 Usman Salis

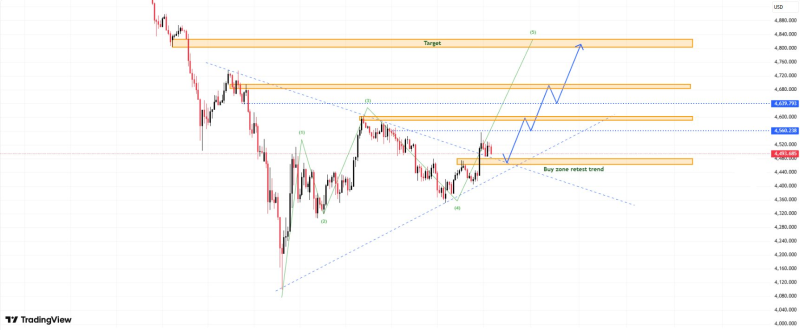
Gold is transitioning from compression to trend as price breaks above a well-defined triangle structure. The chart shows a clean move through descending resistance, followed by stabilization above the breakout base - confirming the shift in market behavior. As Annette highlighted, the breakout unlocks room for continuation, with the $4,830 region now in focus as the next upside objective.
The Gold Triangle Structure That Finally Gave Way
Before the breakout, gold was trading inside a tightening formation marked by lower highs and rising support - classic triangle compression. This pattern reflects a market in balance, where volatility contracts before expansion.
The breakout is technically significant because price did not just spike above resistance - it held above it. That distinction separates valid breakouts from failed moves.
Gold Price Analysis: $5,100 Ascending Triangle Signals Breakout explored a similar structure at a higher level, showing how consolidation patterns in gold tend to resolve into directional moves once resistance is cleared with conviction.
The XAU/USD Level That Now Holds the Trend Together
The chart clearly marks a buy zone retest area just below current price. This area represents the former consolidation range and now acts as support following the breakout. The tweet explicitly notes that continuation depends on price holding above this breakout base and avoiding a deeper return into the prior range.
That makes this level structurally critical:
- Holding above it keeps the breakout valid
- A shallow retest reinforces bullish continuation
- A deeper pullback would weaken the pattern
XAU/USD Gold Price Analysis: $4,570 Support Level Determines Next Move shows how key support zones have shaped gold's directional bias in recent price action - the same principle now applies to the current breakout base.
The Stair-Step Path Toward $4,830 Gold Target
Above current levels, the chart outlines multiple resistance zones, with price expected to move in stages rather than a straight line. The projected path shows a sequence of higher highs and higher lows, consistent with a trending market. The $4,800-$4,830 area stands out as the primary target, aligning with prior resistance and projected extension levels.
Strong trends typically show controlled pullbacks, respect for new support zones, and continuation after minor consolidation - gold is currently positioned within that framework.
Price Analysis: Gold Faces $4,600 Resistance After $4,660 High captured the resistance dynamics playing out at lower levels, providing context for how gold has been working through overhead supply on its way toward the current breakout zone.
The breakout has already shifted the structure from neutral to bullish. What matters now is not the breakout itself - but how price behaves after it. As long as gold remains above the breakout base and avoids returning to the prior range, the structure continues to favor upside expansion toward $4,830.
 Usman Salis


