 Saad Ullah

⬤ Gold has shifted into consolidation mode after getting knocked down earlier in the session, with XAU/USD now hovering just above the $4,570 mark. The hourly chart shows a modest bounce after testing lower ground, which tells us traders are keeping a close eye on this zone to see what happens next. Right now, $4,570 is the line in the sand that could push gold back up or send it tumbling further.
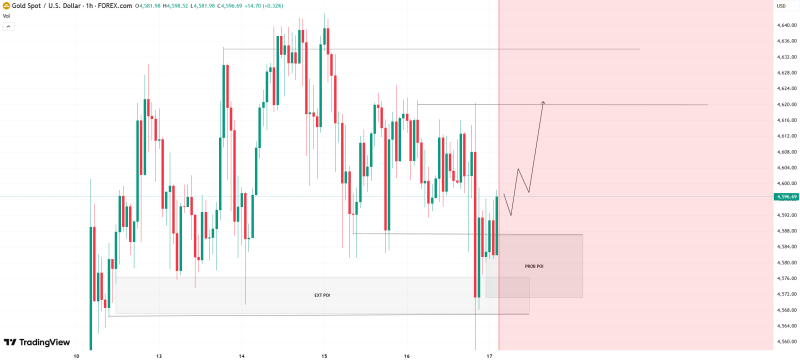
⬤ The chart makes it pretty clear there's solid support around $4,570, backed up by several recent bounces and those long wicks pointing down. Current candles show gold sitting between $4,580 and $4,600, which means the selling pressure has eased up for now. If XAU/USD can stay above $4,570, the chart suggests we might see a recovery push toward $4,620, where prices hit resistance before.
⬤ But there's also a clear downside path mapped out. If gold drops below $4,570 and stays there, that support breaks down and opens the door for more weakness. The chart points to $4,530 as the next key level down, which lines up with where prices could land if sellers stay in control.
⬤ This setup matters because gold tends to get volatile around major support zones like this. Staying above $4,570 would keep the short-term bullish case alive and calm things down a bit, while breaking below could mean we're in for a deeper pullback with more downside momentum. With XAU/USD sitting right at this crossroads, what happens at $4,570 will likely set the tone for gold's next leg.
 Saad Ullah


