Victoria Bazir

Tesla's price structure is entering a critical phase. The 3-day chart shows a clear rejection around $488, followed by a steady decline toward the mid-range of a broader channel near $326 - a level that has repeatedly acted as a turning point in the trend. Ali Charts flagged this setup as one of the more important technical junctures for TSLA in the current cycle.
Price has been forming lower highs since the $488 peak, signaling weakening bullish momentum - but the structure still looks like rotation, not a full collapse.
Since the rejection from upper channel resistance, price has been carving a series of lower highs. The decline looks controlled rather than impulsive - pointing to rotation within a larger structure rather than an outright breakdown, at least for now.
The $488 TSLA Rejection That Shifted Market Structure
The chart marks a strong move into late 2025, where TSLA pushed toward the upper boundary near $488 before sharply reversing. That single candle marked the transition from upward expansion into a corrective phase that has defined price action ever since.
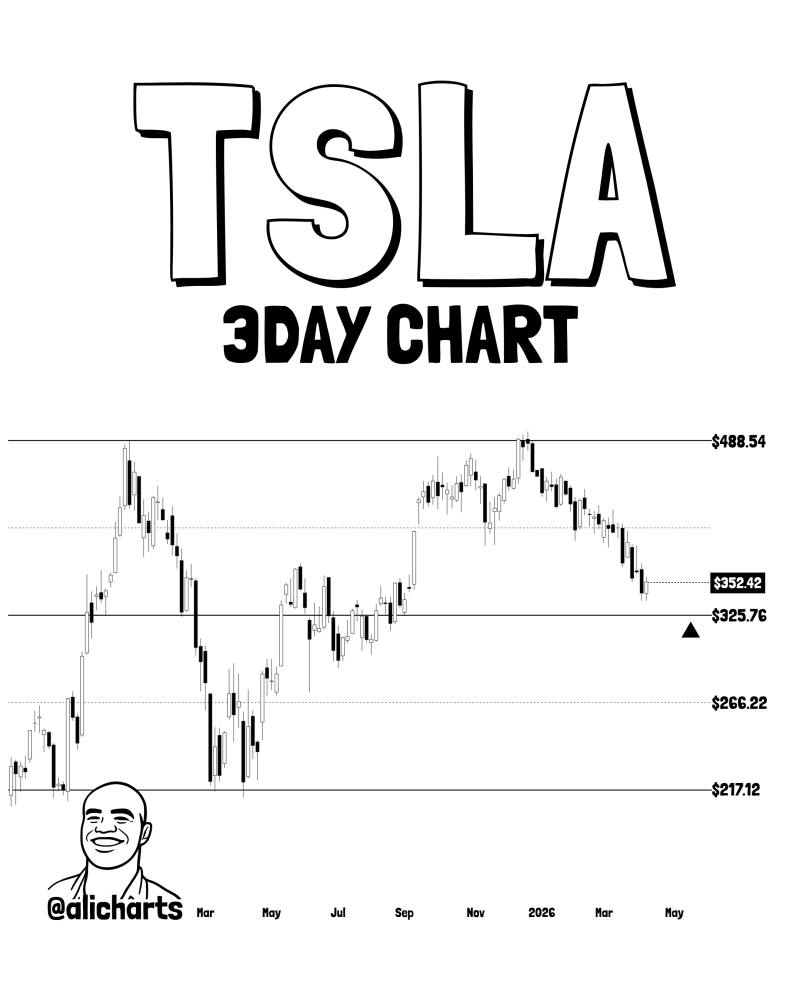
The move was not a collapse - it was a structured retreat. Each bounce has failed to reclaim the prior high, which is the textbook definition of a weakening trend within an otherwise intact channel.
Why the TSLA Mid-Range at $326 Matters Right Now
TSLA is now trading below the $352 area and drifting toward the channel mid-line at $326. This level aligns with prior consolidation zones and has historically served as a pivot - where sellers exhaust and buyers step in, or where support gives way entirely.
The reaction at $326 will be key. Two scenarios are in play:
- A hold at this level could confirm the channel remains intact and trigger a rebound toward $360 as the first recovery target
- A break below $326 would open the path toward lower support near $266 - the lower boundary of the broader range
The mid-range at $326 is where the broader trend finds its balance - a sustained break below it changes the entire technical picture.
This mid-line is not just a support level. It represents the balance point of the broader trend - the zone where the market decides whether the current pullback is a buying opportunity or the beginning of a deeper move lower. Similar behavior has been documented in prior TSLA pullbacks to key channel levels, where defined support zones triggered meaningful bounces.
The TSLA Reaction Zone Traders Are Watching Closely
The current setup is less about predicting direction and more about observing behavior at support. A high-volume bounce from $326 would shift momentum back upward - with $360 as the first zone to reclaim. Failure to hold would signal that the structure is deteriorating, increasing the probability of a deeper retracement toward the range's lower boundary.
As seen in earlier TSLA analysis near the $412 support area, the stock has a pattern of sharp reactions when it approaches well-defined channel levels. The $326 zone now carries that same weight.
Tesla is at a decision point - and the next move will be defined not by the level itself, but by how strongly the market responds to it.
 Victoria Bazir