 Eseandre Mordi

⬤ Tesla stock pushed deeper into correction territory during recent sessions, with TSLA dropping sharply from late-cycle highs and hitting a downside extreme on the four-hour chart. The pullback came after choppy consolidation following the stock's peak near $480–$500, before accelerating lower into a critical technical zone. Price action is now showing early stabilization signals after the sharp decline.
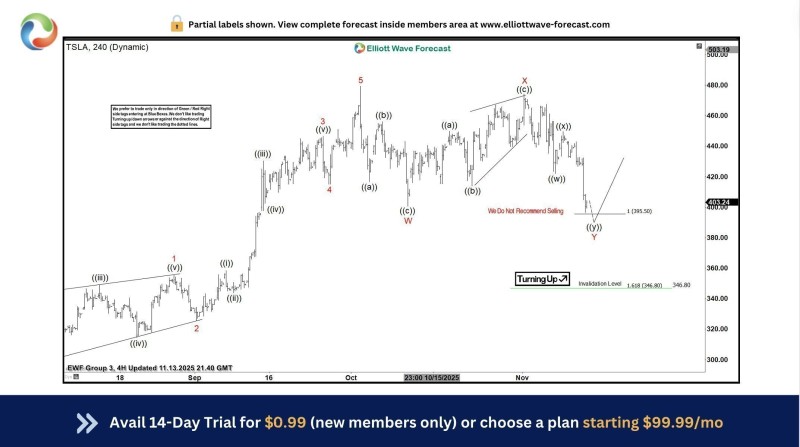
⬤ The pullback reached an extreme area that historically brings buyers back in, creating conditions for at least a three-wave bounce. The chart shows TSLA finding support in the $395–$405 region, where the corrective structure is labeled as wave ((y)). This zone marks the potential end of a W-X-Y corrective sequence, suggesting the selling phase might be wrapping up rather than starting a fresh impulsive decline.
⬤ The Elliott Wave structure emphasizes the recent drop remains corrective rather than impulsive. A projected recovery path points to a rebound within the broader trading range from current lows. The invalidation level sits near $346.80, meaning the bullish corrective view stays valid as long as price holds above that mark. The analysis specifically notes selling into the current area isn't recommended, backing the view that downside risk looks limited near-term.
⬤ This technical setup matters for market sentiment since Tesla often leads among high-beta growth stocks. A confirmed bounce from current support could stabilize short-term momentum and ease broader risk aversion, while breaking below this area would reopen downside scenarios. Right now, the chart signals a potential shift from aggressive selling toward corrective recovery, putting focus on how TSLA performs around its recent lows.
 Eseandre Mordi


