 Alex Dudov

⬤ Tesla's about to hit some make-or-break technical levels right before earnings come out Wednesday after the close. The 8-hour chart shows TSLA sitting in a tight spot after its recent rally, with clean resistance and support zones that'll likely decide where the stock heads next. Right now, price action is holding within a Fibonacci structure that's been guiding moves for weeks.
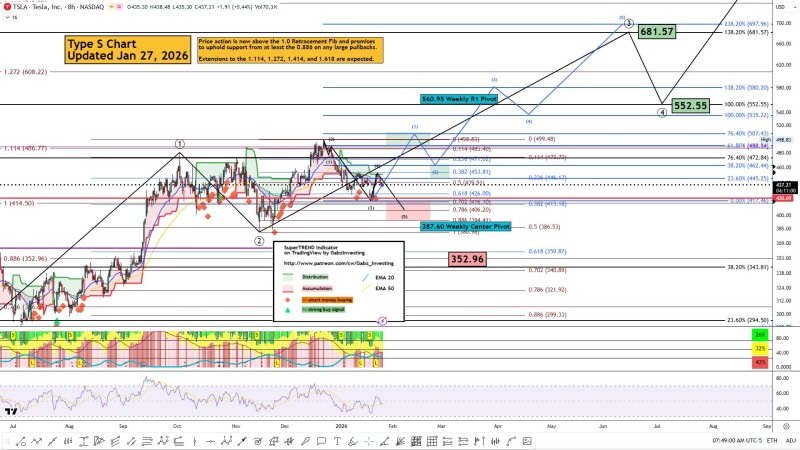
⬤ If Tesla rips higher, first stop is $507.43 — that's where previous price action and Fibonacci levels line up as solid resistance. Push through that, and the chart's mapping out a five-wave impulse pattern that could take TSLA toward the $560.95 weekly pivot. "The technical pathway illustrated on the chart outlines a potential impulsive structure consisting of five waves," with the extreme upside target sitting way up at $681.57 based on extended Fibonacci projections.
⬤ On the flip side, there's layered support below. First cushion comes in around $406, then the bigger level at $387.60 which matches up with the weekly center pivot. If selling really picks up, the chart shows $352.96 as the deep support zone — that's the 0.886 log Fib retracement. That level would be more of a structural pullback than a total breakdown, basically a reset if bears take control short-term.
⬤ These levels matter because Tesla earnings always bring wild volatility. The weekly pivots are spread wide — R1 at $560.95, center at $387.60, S1 down at $276.37 — which tells you big swings are on the table. How TSLA handles that $507 resistance or $387 support zone after earnings will pretty much set the tone for where this
 Alex Dudov


