 Artem Voloskovets

Tesla (TSLA) is in a quiet phase right now, but the chart is building tension. Trading around $407 on the two-week timeframe, the stock has been grinding sideways just above its 20-period simple moving average near $395. It does not look like a breakdown. It looks more like a reset.
$395 Moving Average Holds as Accumulation Zone
The 20-period SMA at $395 has been a recurring reference point across multiple pullbacks. Each time price dips into the $390 range, buyers have shown up consistently. The sideways action is shaking out weaker hands rather than marking a trend reversal. Longer-term participants appear to be quietly accumulating while short-term traders chase swings. That kind of behavior tends to precede a more decisive move.
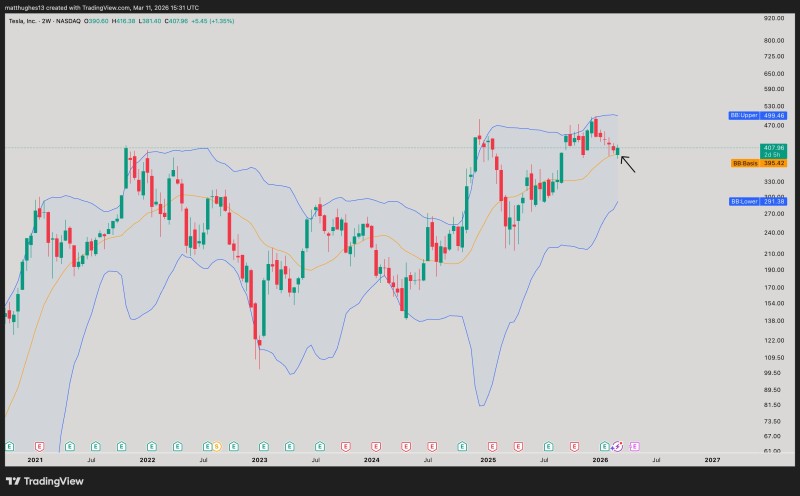
Bollinger Bands Squeeze Signals Compression Before a Bigger Move
The Bollinger Bands tell a similar story. The upper band sits near $499, the lower near $291, and the two are gradually closing in as volatility contracts. This kind of squeeze is a classic setup in technical analysis. It does not predict direction on its own, but it signals that the market is coiling. The longer the compression holds, the more energy builds behind whatever move comes next.
Broader coverage reinforces the significance of this zone. Analysis covering Tesla's $400 support trendline and wedge formation describes a nearly identical tightening structure, while a separate TSLA channel analysis near $412 frames the current consolidation as a pause in momentum, not a reversal. Taken together, the $390-$400 band looks less like a danger zone and more like a platform.
Until Tesla breaks convincingly above $410 or loses $395, the most honest read is that the stock is waiting. The Bollinger squeeze will resolve. The question is which side absorbs the move first.
 Artem Voloskovets


