Eseandre Mordi

Tesla stock is showing a clear shift in price structure. After completing a multi-leg corrective decline into the $337 area, TSLA appears to be transitioning into an impulsive bullish phase - the kind of move Elliott Wave traders watch closely as a signal that the trend is ready to extend. The technical picture, as highlighted by Elliottwave Forecast, points to a developing five-wave sequence that could carry the stock meaningfully higher, provided the key $337 invalidation level continues to hold.
The moment TSLA structure turned higher
Tesla stock is showing a meaningful shift in price behavior, with recent movement aligning with an emerging impulsive phase in technical analysis. According to a chart shared by Elliottwave Forecast, the transition from a completed corrective structure into a developing bullish sequence suggests that TSLA may be entering a stronger directional trend.
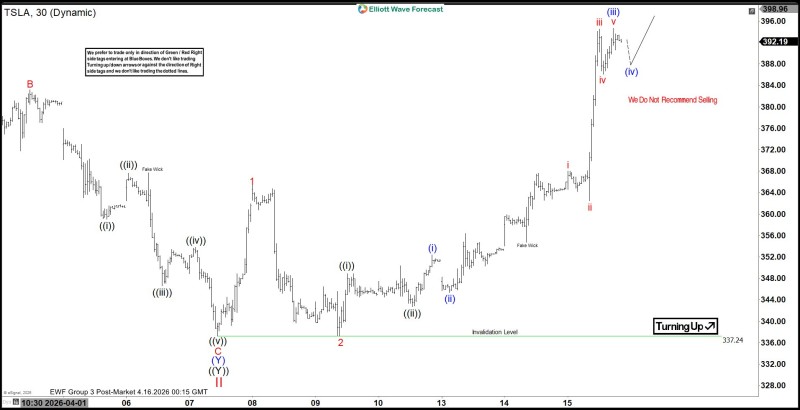
The chart shows TSLA completing a multi-leg corrective decline into the 337 area, where a labeled wave (II) bottom formed. This level also acts as the invalidation line - reinforcing its critical role in defining the broader structure. From that base, price begins forming a sequence of higher highs and higher lows, building into a developing five-wave pattern.
Earlier price action was fragmented and overlapping, while the current structure shows clearer directional intent - that shift is often where trends begin to extend.
TSLA acceleration into the third wave rally toward $392-$396
Waves (i) and (ii) formed first, followed by a strong extension into wave (iii). This transition from overlapping corrective price action into a cleaner upward structure signals a change in market behavior - one that typically reflects strengthening buyer control. The most aggressive portion of the move appears in the rally from the mid-360s into the 390 area, labeled as wave (iii).
In Elliott Wave theory, the third wave is often the strongest portion of the trend. The rally here is sharp and directional, with minimal pullbacks - reinforcing the idea of impulsive behavior rather than corrective noise. The structure becomes increasingly vertical as price pushes toward the 392-396 zone. The chart does not indicate major resistance break levels or moving averages, keeping focus purely on wave structure and price progression.
TSLA wave (iv) pause and the path toward completion
Following the strong upward push, TSLA enters a pullback labeled as wave (iv). This consolidation occurs just below the recent highs, indicating a pause rather than a breakdown in trend. The projected path points to another move higher into wave (v), which would complete the current impulsive sequence. Notably, the annotation on the chart explicitly states that selling is not recommended during this phase - reinforcing the bullish interpretation of the structure.
As long as price holds above the 337 invalidation level, the current wave count remains intact and supports the continuation scenario. The broader takeaway is the transition from correction to impulse. TSLA is now forming a sequence that aligns with a developing bullish cycle, with momentum concentrated in higher highs and structured pullbacks rather than erratic movement.
As long as the 337 level holds, the wave count stays valid and the continuation scenario remains the primary path.
For broader context, Tesla has previously reached the $1,000 threshold twice in its trading history - a reference point that underscores the stock's capacity for extended impulsive moves when structural conditions align.
 Eseandre Mordi