 Sergey Diakov
⬤ Tesla stock is sitting comfortably near its recent peaks, riding a wave of momentum that's been building since early this year. The charts show TSLA climbing steadily after finding solid footing at higher levels, with the price now settling in above what used to be resistance zones. Instead of pulling back, the market seems to be getting comfortable with these elevated prices.
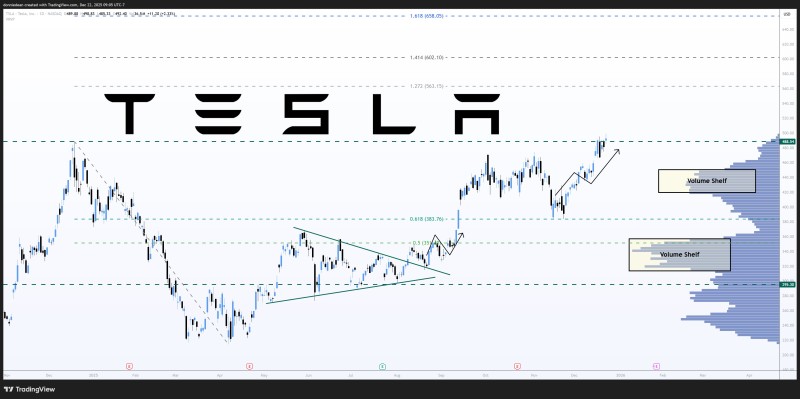
⬤ Right now, TSLA is doing something traders watch closely—it's trying to turn old resistance into new support. The stock has pushed confidently above the $383 level (the 0.618 Fibonacci retracement) and kept climbing toward the upper ranges shown on technical charts. What's interesting is the volume profile data, which shows clusters of heavy trading activity. These "volume shelves" often act like safety nets when prices dip.
⬤ Looking further out, there's a major technical target sitting at $658.05—the 1.618 Fibonacci extension, better known as the Golden Ratio. This isn't just a random number; it's a mathematically-derived projection based on Tesla's previous price swings. The journey toward this level has been marked by higher lows and consistent buying pressure, showing that investors haven't lost interest despite the rally.
⬤ Why does this matter beyond just Tesla? Because TSLA is a heavyweight in growth-focused indexes and drives a lot of market sentiment. When Tesla performs well, it tends to lift confidence across the entire tech and EV space. The way price, volume patterns, and Fibonacci levels are lining up right now shows how technical analysis is shaping where traders are placing their bets as Tesla continues its upward march.
 Sergey Diakov


