 Marina Lyubimova

⬤ Tesla (TSLA) has drifted down to test major support near $394, which lines up almost perfectly with the 200-day exponential moving average on the daily chart. Right now, the stock is trading below both its 20 EMA and 50 EMA, which isn't a great sign for momentum. This pullback has traders watching closely because several bearish indicators are flashing warning signs in the near term.
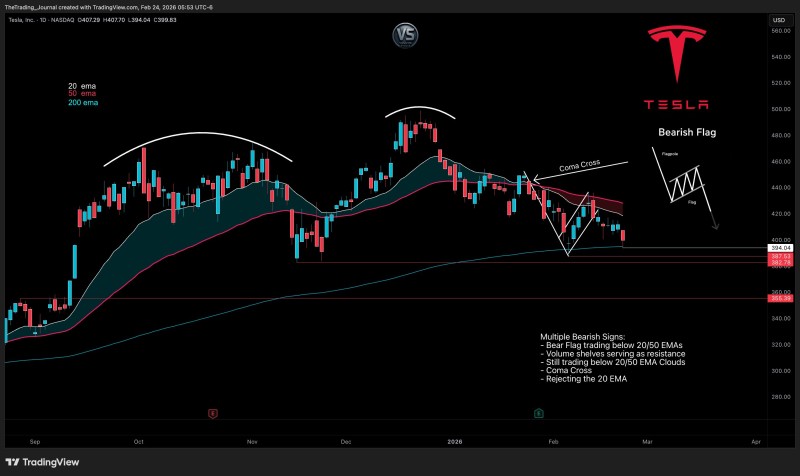
⬤ The TradingView chart shows TSLA on the daily timeframe with the 20 EMA and 50 EMA cloud sitting above current prices, while the 200 EMA provides support underneath. There's a bearish flag pattern forming, and annotations on the chart point out a "coma cross" - basically a negative crossover between the shorter moving averages. That's never fun to see. The pattern suggests downside pressure isn't going away anytime soon as TSLA Stock Analysis: Tesla Trades Near $412 Support as Channel Holds indicates the stock keeps bumping its head against dynamic resistance. Horizontal support sits in the $387 to $382 zone, where buyers might finally step in to catch the falling knife.
⬤ The technical signals aren't pretty - TSLA is trading below both the 20 EMA and 50 EMA, which confirms the short-term bearish setup. The chart's marked up with multiple red flags: rejection at the 20 EMA, volume profiles acting as resistance, and the trend stuck under the moving average cloud. As one analyst put it, "The current structure shows clear rejection at key resistance levels, with volume confirming the weakness." This lines up with other recent market coverage, though some analysts point to different support levels like $412 or just above $400, reflecting how choppy and volatile things have gotten.
⬤ What happens around this $394 support and 200 EMA really matters because these levels often mark major turning points. If TSLA can hold above the 200 EMA, it might stabilize and catch its breath, potentially slowing down this corrective slide. But if it breaks cleanly below, that could signal deeper trouble ahead. Recent analysis from Tesla (TSLA) Price Analysis: Breakout Could Drive Stock Toward $500 showed the upside potential if momentum shifts, while TSLA Holds Steady Near $480 as Consolidation Pattern Emerges highlighted earlier stability zones. How traders and algorithms read TSLA's position at these critical moving averages and support bands will likely shape where the stock heads in the coming weeks.
 Marina Lyubimova


