 Victoria Bazir
⬤ Tesla wrapped up the week with minimal movement after bouncing back earlier in December, hovering around $480 on both daily and monthly charts. The price is sitting above rising support but stalling just under a clear resistance zone. Recent sessions lost some steam as money flowed into other tech stocks, though big players seem to be sticking around.
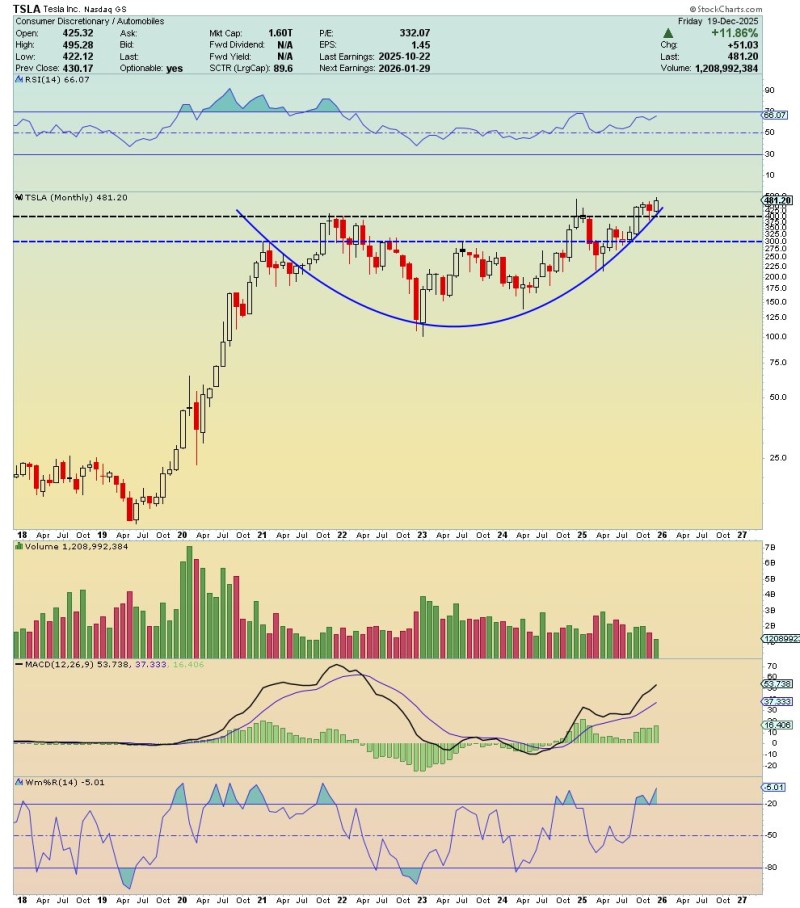
⬤ On the monthly timeframe, TSLA is building a broad rounded base that's been taking shape since the 2022 pullback. The stock is holding nicely above its long-term curved trendline and consolidating right below major resistance between $480 and $500. Momentum looks healthy—RSI is holding above the middle range and MACD stays positive, which suggests accumulation rather than selling at these levels.
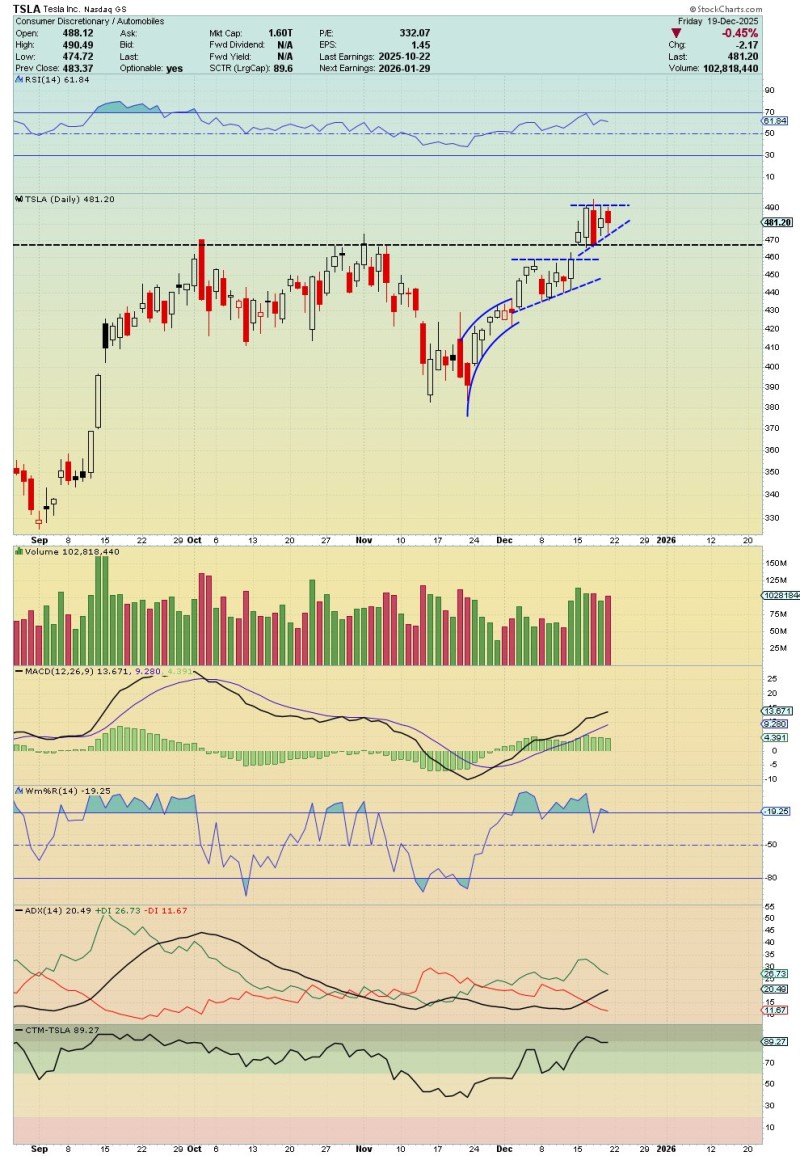
⬤ The daily chart shows two back-to-back ascending triangles that formed throughout December. Both times, TSLA respected the rising support while bumping into resistance in the upper $480s. These patterns showed up with heavier volume after the sharp bounce from November's lows near $390. Short-term indicators are tightening up rather than breaking down, typical of consolidation after a solid run rather than renewed weakness.
⬤ This matters for the broader market since Tesla drives a lot of sentiment in the Nasdaq and consumer discretionary space. When a stock consolidates near highs like this, it often shapes expectations about whether the trend continues and who leads the sector. How TSLA breaks out of this tight range could set the tone for near-term momentum in large-cap growth stocks and show where money is rotating within tech.
 Victoria Bazir


