 Usman Salis

⬤TSLA is in a consolidation phase after pulling back from recent highs near $498. On the two-day chart, the stock is stabilizing within a clear demand zone, forming a base that could set up a renewed rally. The structure points to a potential launch area if buyers stay in control and support continues to hold.
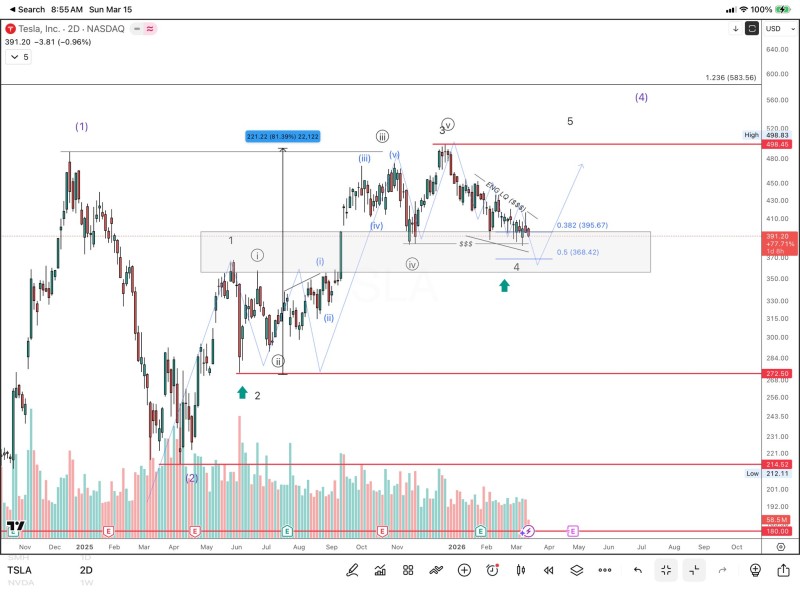
⬤The chart maps out a broader Elliott Wave framework where the recent decline reads as a corrective phase inside a larger bullish cycle. Tesla retraced toward the 0.382 and 0.5 Fibonacci levels, sitting around $395 and $368 respectively. These zones have historically attracted buyers, and Tesla's test of $383-$396 support reinforces just how significant this area remains for the broader trend.
⬤Resistance sits near $498, the previous swing high and the key hurdle for any bullish continuation. A clean break above that level opens the projected path toward $500-$550. TSLA holding near $480 while consolidating below the $480-$500 band shows how tight the range has become, which often precedes a sharp directional move.
⬤The bigger picture for TSLA hinges on how price reacts within the current support structure. If the demand zone holds and momentum builds, the chart favors a challenge of $500 and potentially higher. A breakout pattern targeting the $500 milestone has already been flagged by analysts, underscoring how quickly momentum can shift once resistance flips to support.
 Usman Salis


