Eseandre Mordi
SOFI stock is approaching a technically important moment as price returns to the $15 area - precisely where the rising trendline meets prior higher-low structure. As Chris noted, this zone is being watched as a potential continuation point within the broader uptrend.
The $15 Uptrend Line Under Pressure
The chart shows a clear ascending trendline that has supported SOFI stock since mid-2024. Each major pullback has respected this structure, producing higher lows and sustaining the broader bullish trend.
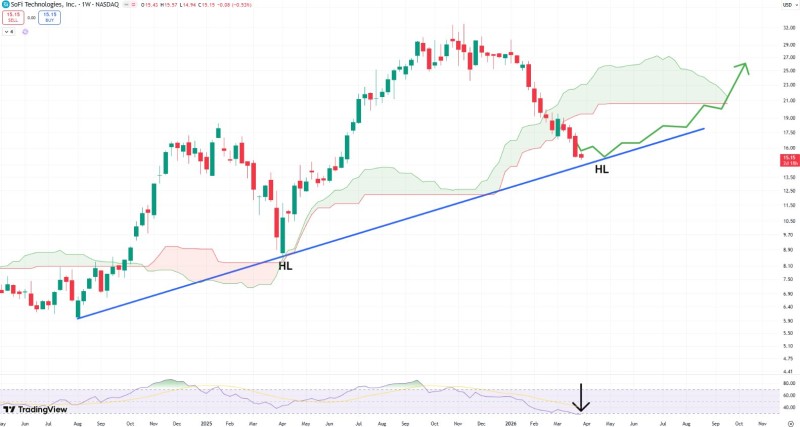
The current move brings price directly back into that trendline, near $15. This level also coincides with the most recent higher low marked on the chart, reinforcing its importance. The structure remains intact as long as price holds above this rising support.
The trendline has not been broken, and price is still respecting the sequence of higher lows.
Unlike a breakdown scenario, the pullback appears orderly, with no sharp structural violation.
A Clean Higher Low Setup Takes Shape at $15
What stands out in the current setup is how precisely price is reacting to support. The chart highlights two previous higher lows, both formed near the same rising trendline support. The current test mirrors that behavior.
Momentum has also cooled during the decline. The RSI shown on the chart has dropped toward the lower range, indicating a reset in momentum rather than a collapse. This type of reset is consistent with continuation patterns rather than reversals.
The structure now suggests a potential third higher low forming at the same technical level.
The $15 region stands out as a convergence of multiple factors:
- Rising trendline support active since mid-2024
- Prior higher low structure
- Psychological round-number level
When Structure Gets Too Obvious
The simplicity of the setup is part of what makes it notable. A clearly defined trendline, repeated higher lows, and a clean retest of support create a textbook technical structure.
That clarity often attracts attention - but it also increases the importance of the level itself.
If SOFI stock holds this zone, the trend remains intact and the higher-low sequence continues. If it fails, the structure breaks, and the uptrend loses its defining support.
Recent broader price action shows SOFI has already retraced significantly from its highs near $30 back toward the mid-teens, reinforcing how important this area has become in the current stock market trend.
A Level That Defines the Next Move for SOFI Stock
At this stage, SOFI stock is not in a neutral position. It is sitting directly on the level that defines whether the uptrend continues or begins to weaken.
The reaction around $15 will likely determine the next directional move, as the market tests whether buyers are still willing to defend the trendline that has guided price action for months.
 Eseandre Mordi