 Usman Salis

SoFi stock is entering a critical technical phase as its prolonged correction aligns with a historically significant support structure. After a steep decline, the current setup suggests the stock is approaching a potential accumulation zone where long-term positioning may begin to emerge.
SOFI Stock Down Hard in 2025 - The Decline That Reset the Structure
SOFI has dropped significantly this year, reflecting sustained selling pressure following its rally toward the $30 region. The chart confirms this shift, showing a clear transition from an uptrend into a structured correction. Price action has produced lower highs and a persistent downward move, consistent with a broader valuation reset seen across recent market coverage.
This is not a random selloff - it is a controlled retracement following an extended upside move.
Where SOFI Price Meets a Critical Fibonacci Cluster at $11-$16
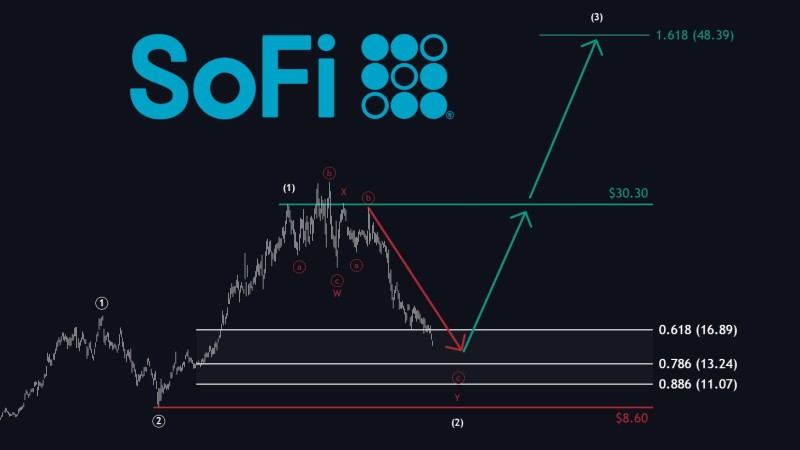
The chart highlights a key demand zone between roughly $16.8 (0.618), $13.2 (0.786), and $11.0 (0.886). This cluster represents a classic retracement region where corrections often stabilize. Recent technical analysis supports this idea, showing SOFI repeatedly testing the $16-$19 range as a major support zone tied to Fibonacci structure.
This aligns closely with the chart's projected path:
- A final leg into support
- Completion of the corrective structure
- Potential transition into accumulation
Importantly, the invalidation level near $8.60 remains intact, defining downside risk within the setup.
SOFI is no longer in a clean downtrend - it is approaching a decision zone.
Recovery Path Targets $30 Resistance - Then Potentially $48
The chart outlines a recovery path that first targets the $30.30 resistance zone - the prior peak area where sellers previously dominated. A breakout above this level would represent a structural shift, confirming the end of the correction and the beginning of a new expansion phase. Longer-term projections extend toward the 1.618 Fibonacci level near $48, consistent with prior SOFI technical structures that point toward large upside targets once consolidation resolves.
The structure now reflects:
- A completed or near-completed corrective leg
- Confluence support across multiple Fibonacci levels
- Defined upside path if support holds
In technical markets, those moments often define the biggest opportunities.
If buyers step in within this zone, the setup supports a longer-term recovery scenario. If not, the structure risks extending toward lower levels. For now, SOFI is not breaking out - it is positioning at a level where cycles typically reset.
 Usman Salis


