 Alex Dudov

⬤SoFi Technologies (SOFI) is showing early signs of stabilization on the daily chart as the stock attempts to reclaim the 0.786 Fibonacci retracement level near $18.83. Bullish divergence has appeared between price action and the Relative Strength Index (RSI), a technical pattern that can signal weakening selling pressure. The TradingView chart shows SOFI trading near $18.60 after recently falling below the Fibonacci level before attempting to recoverback above it.
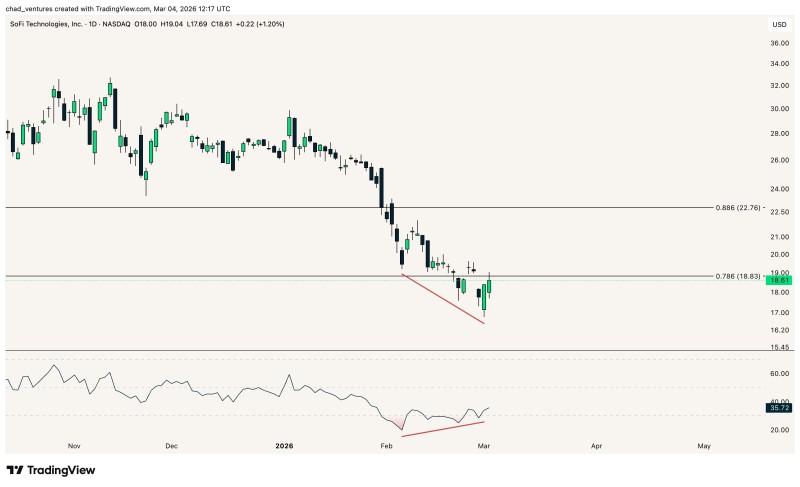
⬤The chart highlights that SOFI experienced a sustained decline from late January through February, with price forming lower lows during the downtrend. At the same time, the RSI indicator began printing higher lows, creating the bullish divergence visible in the lower panel of the chart. This pattern occurs when price continues falling while momentum indicators begin strengthening, often suggesting that downward momentum may be fading.
⬤The most important level currently visible on the chart is the 0.786 Fibonacci retracement at $18.83. Fibonacci retracement zones are widely used by traders to identify potential support or resistance levels after large price movements. If SOFI manages to reclaim this level and hold above it, the chart suggests the stock may attempt to form a local bottom following the recent decline. Technical analysis shows a cup and handle patterncould signal further upside potential if support holds.
⬤The presence of bullish RSI divergence while price tests an important Fibonacci level places SoFi Technologies at a notable technical moment. Momentum divergences often appear when trends begin losing strength and markets transition into consolidation phases. Whether SOFI successfully reclaims the $18.83 level or continues trading below it could shape the next phase of price action in the coming sessions. Analysts currently see potential upside to $38, suggesting room for recovery if technical support holds.
 Alex Dudov


