Alex Dudov

SOFI is approaching a critical inflection point ahead of the April 2 expiry, with options positioning revealing a clear imbalance between downside and upside exposure. With price near $15 and max pain at $17, the setup highlights a market sitting just below a key activation level. Analysis shared by Fibby outlines a step-by-step activation sequence that traders are watching closely.
$17 acts as the pin — until price reaches that zone, the setup remains inactive despite the visible buildup in options exposure.
$17 SOFI Level Acting as the Pin
The chart clearly identifies $17 as the max pain level, with price roughly $2 below. This gap is central to the current structure, as positioning often gravitates toward this level into expiry. Dealer behavior begins to matter more once price reaches that zone, making $17 the immediate focal point for short-term price action.
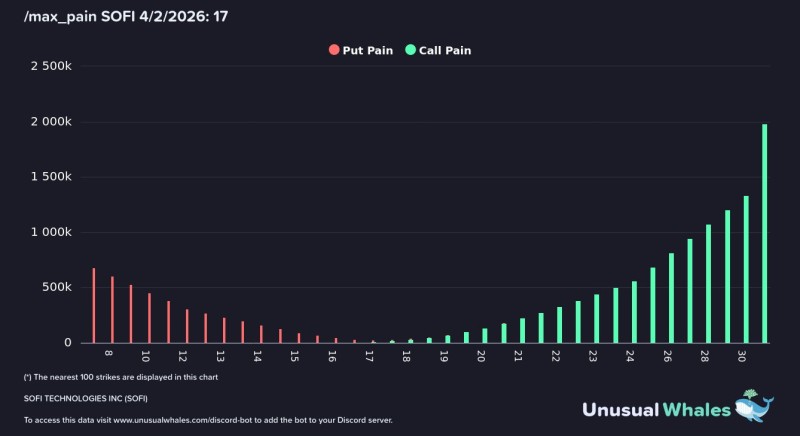
SOFI Call Exposure Builds Aggressively Above $20
Above the current price, the chart shows a steep call ladder forming from $20 up to $30. The distribution is not uniform - it accelerates as strikes move higher, with the largest concentration near $30. The structure reflects:
- Light positioning near $17-$20
- Increasing exposure through the low $20s
- Heavy concentration toward $30
This aligns with the description of a ladder where positioning grows at each level, suggesting that upside pressure could intensify if price moves into these zones.
The positioning structure above $20 is fully built - what's missing is the trigger, not the fuel.
Downside Structure Shows Little Support Below $13
On the downside, the chart confirms that put exposure fades significantly below $13, leaving minimal structural support underneath. This creates a clear imbalance:
- Weak put positioning below $13
- Limited downside reinforcement
- Strong asymmetry versus the call-heavy upside
The absence of meaningful downside positioning reinforces the idea that the structure is skewed toward higher levels once activation begins. For broader context, institutions have been stacking 161 million shares between $16 and $17, adding another layer to the structural setup.
The Sequence That Could Trigger SOFI Price Acceleration
The setup outlines a step-by-step activation rather than a single breakout level:
- $17 as the pin level
- $20 as the trigger
- $22-$30 as the zone where positioning intensifies
Once price moves through these levels, the structure suggests a potential chain reaction as dealers adjust positioning. This aligns with broader technical setups in SOFI, where key levels often act as decision zones before expansion phases begin. Some analyst price forecasts already project potential upside to $38.
Puts fade by $13 - the structure below is thin, and the asymmetry above is where the real story sits.
A SOFI Setup Waiting for Activation
SOFI remains below the level where positioning begins to exert stronger influence, but the structure above price is already fully built. The chart reflects potential energy rather than active momentum. The key question is whether price can close the gap toward $17 - if that happens, the positioning structure suggests the market could shift quickly as higher strike exposure comes into play.
 Alex Dudov