 Marina Lyubimova

NVIDIA is entering one of its most technically sensitive phases in recent months. Price is now testing a key support cluster that The Analyst has flagged as a decisive inflection point - one where the outcome carries real consequences for the stock's medium-term trajectory.
NVDA Stock Approaches Key Fibonacci Confluence
After an extended rally, NVDA has shifted into a corrective phase, pulling back toward a cluster of technical levels that are difficult to ignore. The chart shows price approaching the 0.382 Fibonacci retracement near the mid-$160s, while simultaneously aligning with the long-term 200-week moving average.
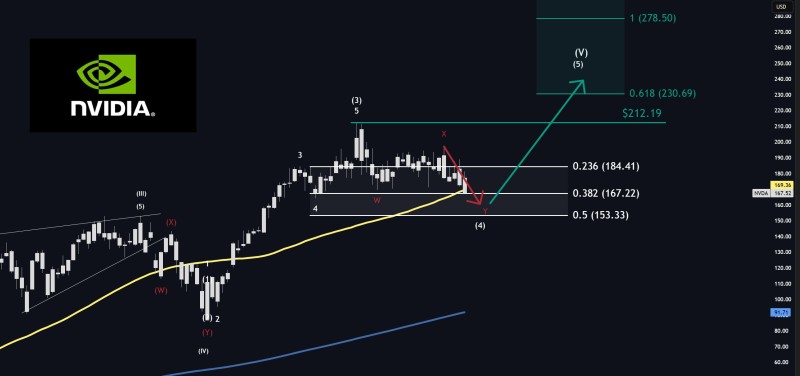
This kind of confluence tends to act as a decision point rather than a casual pause. Buyers are being tested here, not driving price. The stock is no longer trending higher - it is reacting within a defined structure, and that distinction matters.
The current move is not yet a confirmed breakdown. It remains a pullback unless key structural support fails.
Recent NVDA technical setups show the stock repeatedly interacting with this same region, reinforcing its role as a genuine battleground between buyers and sellers.
NVDA Stock Compression Signals a Major Move Ahead
The broader chart structure still reflects an uptrend, but the latest move introduces short-term weakness. NVDA is now trading between Fibonacci levels rather than expanding upward, a behavior consistent with consolidation patterns seen across multiple timeframes.
What stands out most in the current structure is compression. Price is tightening between declining momentum and strong underlying support - a pattern that typically precedes a larger directional move in either direction.
Price is coiling near support while building pressure. The next expansion from this zone tends to be sharp.
The $153 Level Is the Line That Matters for NVDA
The single most important level in the current setup is $153, corresponding to the 0.5 Fibonacci retracement on the chart.
Holding $153 would preserve the broader structure and keep the long-term bullish trend intact. It would confirm that the current move is simply a retracement within a larger upward cycle, with room to reload for a push higher.
A breakdown below $153, however, would shift the technical picture significantly. Based on the scenario outlined in the chart, losing this level opens the path to considerably lower prices:
- Downside projection 1: $120 area
- Downside projection 2: $100 region
- Upside target if support holds: $230 zone
Previous NVDA analysis targeting $240+ identified similar structural setups where compression near support preceded a strong directional expansion.
If $153 fails to hold, the shift in structure could accelerate selling pressure quickly - that level is not just a number, it's the line that separates a healthy pullback from something more serious.
For now, NVDA sits at a genuine inflection point. The reaction at support carries more weight than any macro narrative - and traders are watching closely.
 Marina Lyubimova


