 Usman Salis
⬤ Nvidia (NVDA) is building a tight technical pattern after its recent rally. On the 4-day chart, the stock is retesting support near its 200-day moving average while squeezing into a wedge formation. If this structure holds, it could trigger a final push higher.
⬤ The chart shows important retracement levels stacked below the current price. Support is sitting around the 0.382 and 0.5 Fibonacci zones in the mid-$150s to upper-$160s, while resistance hovers near the 0.236 level around mid-$180s. The projected trajectory mapped out on the chart suggests a possible extension toward the $240+ area if price breaks out from this tightening range.
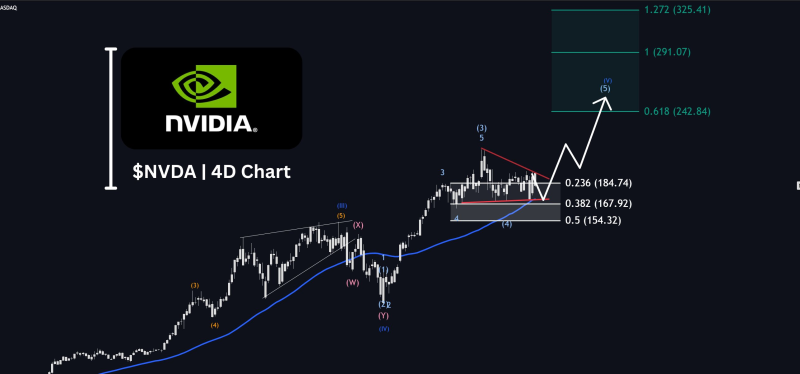
⬤ This structure looks like part of a larger uptrend with a healthy pullback into support rather than any kind of reversal signal.
⬤ The chart suggests earnings could serve as the spark that brings volatility and helps the squeeze scenario unfold—but only if momentum comes back strong. How price reacts around support and the moving average will decide whether NVDA breaks out with continuation or stays stuck in consolidation mode. That outcome could set the tone for short-term sentiment as traders watch to see if the stock follows the projected path toward higher ground.
⬤ For more context on recent price action, check out how Nvidia drops below support then snaps back at 200-day MA, how NVDA holds $170 support just below ATH breakout setup, and how NVDA forms weekly ascending triangle between $186-$194.
 Usman Salis


