Usman Salis

NVIDIA is approaching a technically significant moment as price reacts precisely at a well-defined support zone. Analyst Banana3 noted the stock is behaving exactly where it should - responding to a level where demand has shown up before, and doing so with consistency.
Where NVDA Price Keeps Finding Support
The chart clearly shows a horizontal support zone around the $158-$160 area, which has been tested multiple times. Each visit to this level has produced a bounce, reinforcing its importance within the current structure.
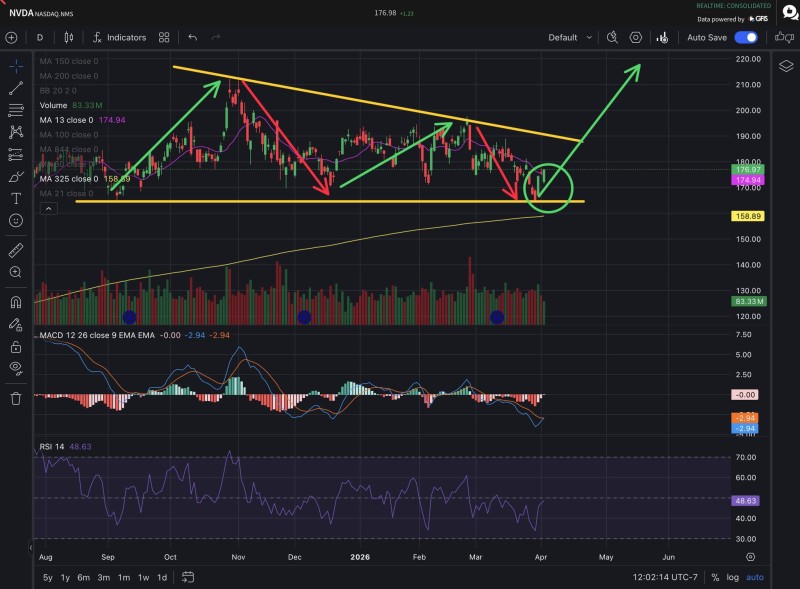
Price is reacting in exactly the right place - this is where demand has shown up before, and the structure continues to hold.
At the same time, a descending trendline from prior highs near the $210-$220 region continues to cap upside attempts. This creates a tightening range defined by lower highs and stable support - a classic compression pattern in technical analysis. The latest move shows price bouncing once again from this support zone, aligning with previous reactions.
A Pattern of Repeated Reactions
The structure is built on a sequence of similar movements:
- Rejections from descending resistance
- Pullbacks into horizontal support
- Bounces forming short-term upward moves
This repetitive behavior highlights a market in consolidation rather than trend. The chart does not show a confirmed breakout or breakdown - only a tightening range where price continues to oscillate between boundaries. Similar range-bound behavior has been observed in NVDA News: Price Consolidates Around $170 - Is $200 Next?, where Nvidia traded sideways within defined levels before a potential expansion phase.
Momentum Reflects Balance, Not Direction
Indicators on the chart support the idea of equilibrium.
- RSI is positioned near the mid-range, around 50, indicating neutral momentum
- MACD remains relatively flat, without a strong directional signal
When RSI sits near 50 and MACD gives no clear signal, the market is essentially telling you it hasn't made up its mind yet.
These conditions typically appear during consolidation phases, when neither buyers nor sellers have control. This aligns with other technical observations in NVDA Stock Analysis: Consolidation Before the Next Move, where tightening ranges often precede a directional breakout.
The NVDA Compression That Signals a Move
The most important feature of the current chart is compression. With resistance trending downward and support holding steady, price is running out of space. This type of structure typically resolves with a breakout once the range becomes too tight to sustain.
The longer price compresses between these levels, the more energy builds up behind the next move - and that move tends to be decisive.
A move above the descending trendline would signal a shift toward bullish momentum, potentially opening the path higher. Conversely, a break below support would invalidate the current structure and suggest continuation lower. This kind of setup has also been highlighted in NVDA Stock Analysis: Gap Fill at $173 in Focus, where tightening price action preceded directional movement.
NVDA stock now sits at a technically sensitive point, where repeated reactions at the $158-$160 support and descending resistance have created a defined range - and the next move is likely to be decisive rather than gradual.
 Usman Salis