 Eseandre Mordi

NIO Inc. has been grinding through a long and painful downtrend, but something has shifted on the weekly chart. The stock is now stabilizing around the $5.30 level, a zone that has quietly turned from resistance into support. After bottoming out near the $3.10-$3.50 range, the current structure hints at a base forming, and traders are starting to pay attention, according to Fibby.
$5.30 Is the Line in the Sand
The $5.30 area is doing real work right now. NIO's weekly base formation near $5 has previously been treated as a launchpad for recovery attempts, and the current setup looks structurally similar.
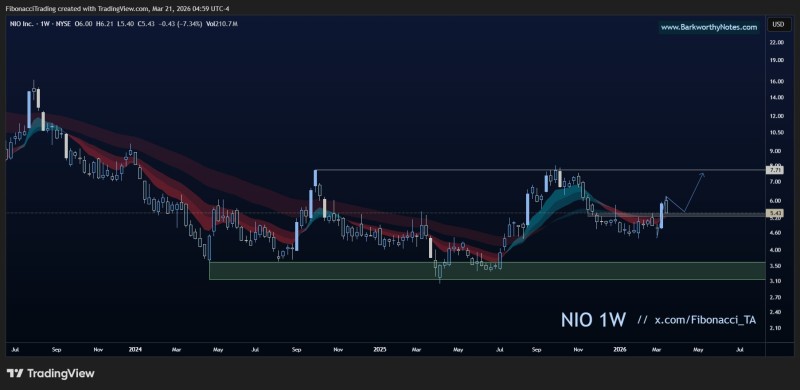
Price has consolidated long enough to suggest sellers are losing steam. Holding this level matters, because losing it would put NIO back in no man's land.
$7.71 Is the Next Real Test
If $5.30 holds, attention shifts to $7.71, the next meaningful overhead barrier. Getting there would confirm that the recovery phase has legs. This aligns with what analysts flagged in NIO's 23% jump as the $7.50 breakout came into focus, where clearing the $7.50-$7.70 range was seen as the trigger for a broader trend shift. A clean break above $7.71 would not just clear resistance; it would signal a meaningful change in momentum.
That said, the setup is not without risk. As covered in NIO's monthly trend analysis after failing to break $5.30, this exact level has rejected price before. Both $5.30 and $7.71 remain central to the longer-term structure, and the interaction between these two zones will determine whether this recovery attempt is real or just noise.
 Eseandre Mordi


