 Artem Voloskovets

Netflix stock is showing a notable technical transition as price moves above a key long-term indicator. According to TJ, NFLX reached $100.8 in pre-market trading, marking its first move above the 200-day moving average since November - a development that signals a potential shift in trend structure.
The NFLX Structure That Finally Flipped
For months, NFLX remained trapped below its 200-day moving average, with price repeatedly rejecting this level. The chart clearly shows a sustained downtrend within a descending channel, where each rally attempt failed to reclaim higher ground.
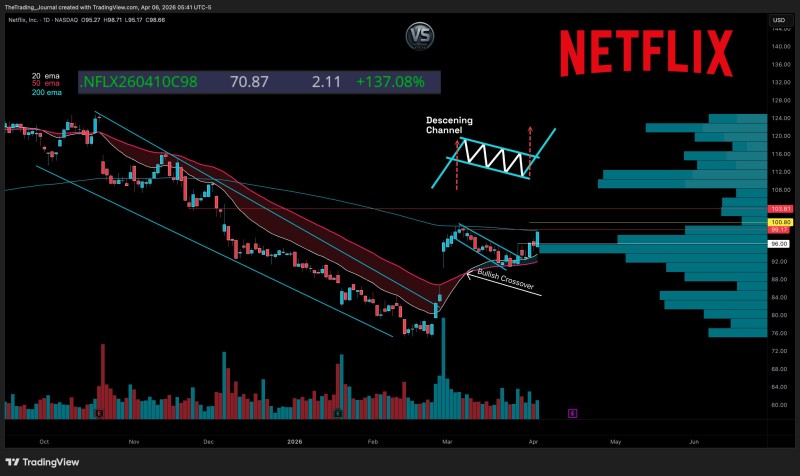
That dynamic has now changed. Price has broken above the 200-day moving average, turning a long-standing resistance level into a potential support zone. This type of reclaim is often watched closely in technical analysis as an early signal that downside pressure is fading.
The break above the 200-day moving average is the kind of structural shift that often goes unnoticed until price is already moving higher.
A similar technical backdrop was seen in NFLX Stock Sinks 30%+ Below 200DMA, where prolonged trading below the 200-day average reflected heavy bearish control before any reversal attempt.
A Breakout From Compression
The chart also highlights a descending channel structure that guided price lower over time. Recently, price pushed out of that channel, forming a higher low and initiating a short-term recovery.
At the same time, shorter-term moving averages are beginning to turn upward, with a visible bullish crossover supporting the move. This combination - channel breakout plus moving average reclaim - reflects a structural transition rather than a simple bounce.
When you see a channel break line up with a moving average reclaim at the same time, that's not noise - that's the market telling you something has changed.
Momentum-driven setups like this often emerge after extended declines, similar to the shift discussed in Netflix Stock Breaks $100s Support: 4-Year Cycle Peak Confirmed, where breaking key levels marked a broader trend change.
Where Netflix Price Faces Its Next Test Near $100-$104
NFLX is now trading into a dense resistance zone around the $100-$104 range, visible on the chart through volume profile clusters. This area previously acted as supply and is now being tested immediately after the breakout. The market is effectively deciding whether this move is a true reversal or just a temporary push higher.
Key developments in the current setup include:
- Price has reclaimed the 200-day moving average
- The descending channel has been broken
- Resistance near $100+ is now under pressure
The $100-$104 zone is where the real test begins. Holding above it changes the entire picture for NFLX going forward.
Recent bullish positioning in options markets also reflects growing upside interest, as highlighted in Netflix Sees $60M+ in Whale Call Buying, suggesting participants are positioning for continuation.
NFLX is not yet in a confirmed uptrend, but the break above the 200-day moving average marks a clear shift in structure. Whether price can hold above this level will determine if the move evolves into a sustained trend reversal or stalls beneath overhead resistance.
 Artem Voloskovets


