Saad Ullah

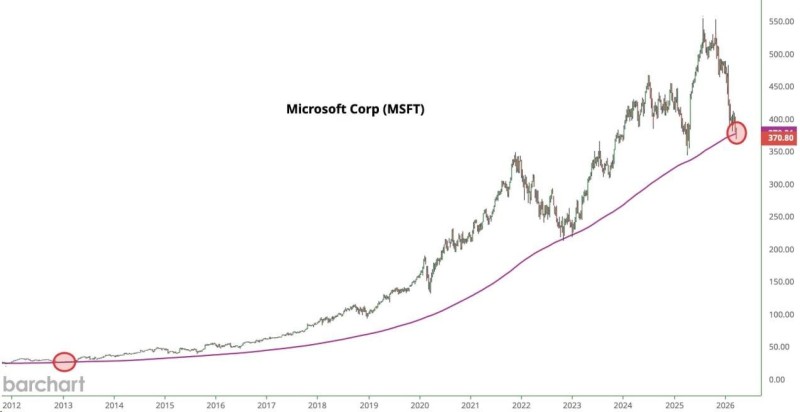
After climbing from below $50 to above $550, Microsoft stock is now deep in one of its most significant corrections in years. The stock has shed more than 30% from its peak, and price is now sitting right on the rising 200-day moving average near the $370 region — a level that hasn't mattered this much in a long time.
This interaction with the 200-day moving average is a key technical event.
CryptoJack was blunt about what this means: this interaction with the 200-day MA is a key technical event. And the context makes it even more significant. MSFT isn't just drifting into support — it's arriving there after a sequence of lower highs and accelerating downside pressure.
A Support Zone That's Being Tested Differently This Time
Throughout Microsoft's long-term uptrend, the 200-day moving average repeatedly acted as a floor. Price would pull back, find support around that curve, and push higher. But this test feels different.
The stock isn't consolidating in an uptrend — it's arriving at support after a genuine breakdown phase, which makes the setup more fragile.
MSFT has pulled back more than 30% from its highs and is now testing major support zones that could define its next direction.
Recent analysis from TheTradable points to a broader support cluster between roughly $350 and $380, where multiple technical indicators stack on top of each other. That confluence reinforces why the current zone matters so much — it's not just one line on a chart.
From Uptrend to Decision Point
The chart structure tells a clear story: a breakdown from peak levels above $550, formation of lower highs on the way down, increasing downside momentum, and price finally aligning with the long-term moving average. The market is no longer trending upward. It's testing whether the bullish foundation can hold.
MSFT is not just testing support — it is testing the foundation of its multi-year rally.
Historical data on MSFT shows that similar tests of long-term moving averages have often been major turning points — sometimes triggering powerful rebounds, other times confirming deeper corrections. The pattern is familiar. The outcome isn't predetermined.
What Happens Next
If price stabilizes here and starts reclaiming higher ground, the long-term bullish structure remains intact and the pullback goes down as a correction within a bigger uptrend. If the stock breaks decisively below this zone, it signals a more serious shift in trend behavior — and opens the door to further downside.
Microsoft's $380 Fibonacci level adds another layer to watch within that support cluster. Either way, the next move from here will likely set the tone for months ahead.
 Saad Ullah