 Marina Lyubimova
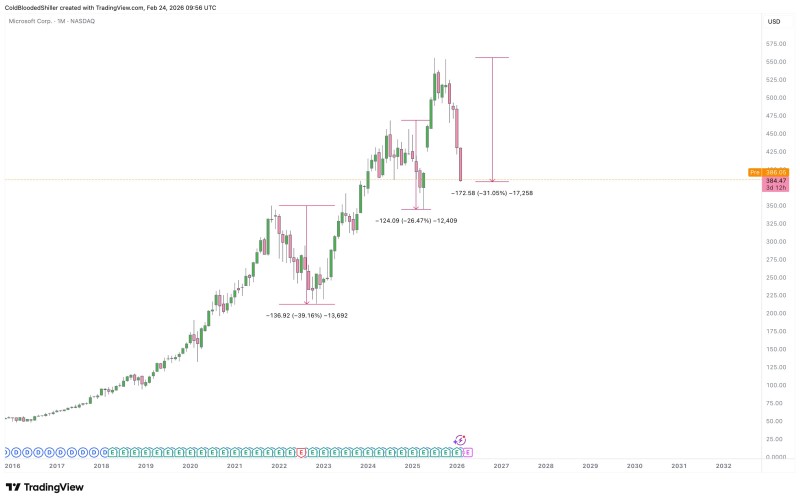
⬤ Microsoft has dropped over 31% from its highs near the mid-$500s down to the mid-$300s, and according to Cold Blooded Shiller, this puts MSFT firmly in the company of its own historical corrections. The monthly TradingView chart shows prior retracements of roughly 39% and 26%, so the current move isn't without precedent. What ties these episodes together is how price behaves around major technical levels - something already explored in detail when MSFT was testing a critical support zone on the monthly chart, where multi-level confluence areas have historically triggered meaningful reactions.
⬤ Beyond pure price action, the narrative around Microsoft has also shifted toward fundamentals. Analysts have pointed to valuation compression amid capital expenditure concerns, with forward earnings multiples contracting as spending cycle expectations evolve. That kind of backdrop can amplify technical selling pressure, especially when a stock is already stretched on higher timeframes.
The current decline is framed against weakening higher timeframe signals - something that sets it apart from prior pullbacks.
⬤ That distinction matters. Earlier corrections played out within strong momentum structures - this one doesn't. Bearish divergences on higher timeframes make the current setup look different in character, not just in size. Some technical perspectives have gone further, suggesting the stock is nearing deeper declines that echo prior pullbacks, drawing direct parallels to past cyclical downturns.
⬤ For the broader market, a 30%+ drawdown in a mega-cap like Microsoft is hard to ignore. How MSFT holds - or doesn't hold - around established multi-year support levels will likely shape sentiment across large-cap tech and fuel the ongoing debate: is this a cyclical retracement, or something more structural?
 Marina Lyubimova


