 Saad Ullah

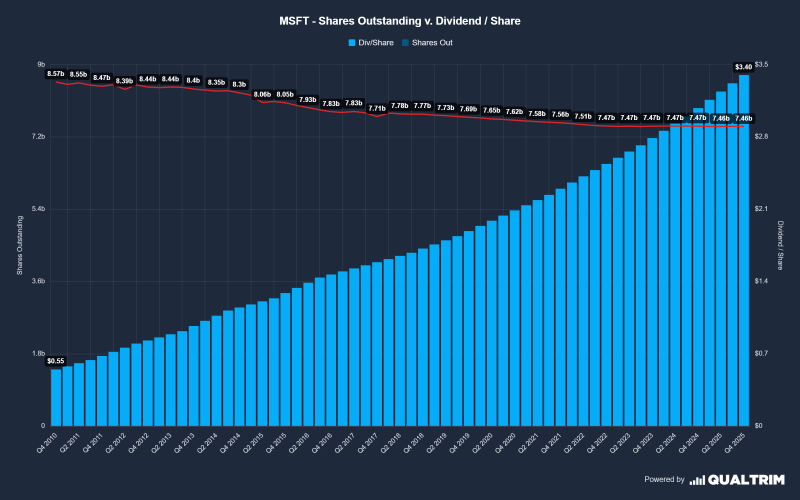
Microsoft's compounding profile is getting renewed attention as long-term data puts two parallel trends in the same frame. As Qualtrim highlighted, the combination of a shrinking share count and a rising dividend per share is what underpins the description of Microsoft as a technology compounder - and the chart makes the case visually across 15 years of data.
The chart shows Microsoft's shares outstanding falling from about 8.57 billion in Q4 2010 to roughly 7.46 billion by Q4 2025 - a reduction of 12.95% over the period. The move is gradual rather than abrupt, with the line trending consistently lower across the full timeframe without any meaningful reversals.
That kind of steady, sustained buyback program rarely attracts headlines in any single quarter, but compounded across 15 years it represents a meaningful shift in how much of the company each remaining share represents.
At the same time, Microsoft's dividend per share rises from about $0.55 in Q4 2010 to $3.40 in Q4 2025 - a 518% increase over the period. The chart shows a persistent upward progression in the payout trend, with no major reversals visible across the entire timeframe.
A dividend growing every year without interruption signals a business generating enough cash flow to return capital reliably - regardless of what broader markets are doing.
That consistency matters as much as the magnitude. A dividend that grows every year without interruption signals a business generating enough cash flow to return capital reliably, regardless of broader market conditions.
Two MSFT Trends, One Compounding Story
Taken together, the chart highlights two clear long-term shifts: fewer shares outstanding and higher dividends per share. Each remaining share is tied to a larger dividend payout than it was in 2010 - and that combination is precisely what makes the compounder label applicable rather than promotional.
MSFT Price-EPS Gap of 33% Signals Potential Opportunity adds a valuation dimension to the shareholder return picture, showing how the earnings trajectory has been diverging from price in a way that reinforces the long-term fundamental case. Microsoft Hits $350 Target but Faces Heavy Resistance Above captures the near-term technical tension - the same stock that has compounded shareholder returns for 15 years is now navigating a chart structure where price faces meaningful overhead resistance before any sustained recovery can develop.
The long-term data does not resolve the short-term technical picture - but it does provide context for why patient holders view pullbacks in MSFT differently than they might in a company without this kind of compounding track record behind it.
 Saad Ullah


