 Artem Voloskovets

Microsoft's stock is sitting at a crossroads right now. Trading around $398.69, MSFT is hugging its 200-week moving average - a level that's historically acted as a safety net during pullbacks. What's catching traders' eyes is the weekly hammer candlestick pattern that's forming, which could signal buyers stepping in to defend against deeper drops. It's one of those technical setups that has everyone watching to see if the stock bounces or breaks.
Why the 200-Week Moving Average Matters for MSFT
The 200-week moving average isn't just another line on a chart - it's a long-term health check for major stocks like Microsoft. MSFT has pulled back from around $500 last year and is now testing this crucial support zone. Looking at the chart, previous tests of similar levels led to stabilization, though the results varied depending on what was happening in the broader market.
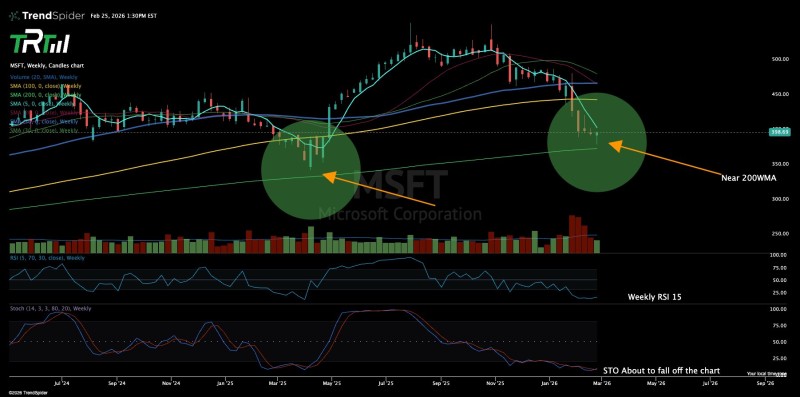
The proximity to this support combined with the hammer pattern suggests buyers might be ready to step up. The weekly RSI is sitting at 15 - deeply oversold territory - while stochastic oscillators are also bottomed out, hinting that the selling pressure may have gotten excessive.
Technical Signals Point to Potential Reversal
Here's where it gets interesting. That hammer candlestick on the weekly chart? It's not a guarantee, but it's definitely worth watching. Hammers can indicate rejection of lower prices, especially when they show up at major support levels. But - and this is important - it needs confirmation. We're talking about closes above defined resistance levels before anyone should get too excited about a reversal.
Microsoft's recent channel breakdown has created shorter-term weakness, making this support test even more significant. The stock is caught between long-term trend support and sustained selling pressure, creating a classic "make or break" moment.
What Happens Next?
Whether MSFT stabilizes here or extends the correction will influence how traders view one of the market's biggest tech stocks. The 200-week moving average test is significant because it blends trend measures with sentiment readings - two things that matter when you're dealing with a stock this size.
Previous rallies after earnings have shown MSFT can snap back quickly when conditions align. But right now, the market's digesting macroeconomic data and earnings developments, which adds another layer of complexity.
 Artem Voloskovets


