 Marina Lyubimova

⬤ Meta Platforms is showing increasing signs of a corrective phase as price structure aligns with a potential wave 2 pullback. Downside pressure is building with META trading near $590-$600 while approaching key Fibonacci support levels. The chart confirms a developing corrective structure within a broader bullish wave sequence, with no confirmed bottom yet.
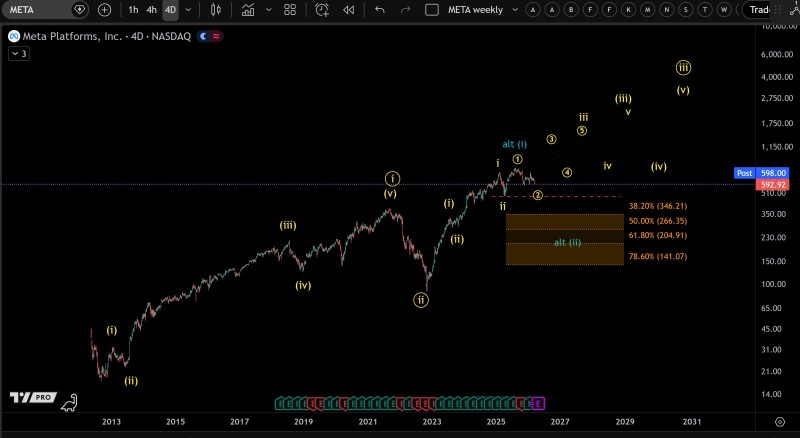
⬤ The analysis highlights a critical support zone between $500 and $576, aligning with multiple Fibonacci retracement levels: the 61.8% level near $576, followed by deeper levels at $527 and $500. Price is already testing the upper boundary of this zone, suggesting further downside remains possible. A similar setup was described in META Stock Faces 200 EMA Rejection, $500 Support at Risk, where analysts noted that losing $500 could trigger a deeper decline.

⬤ A key invalidation level sits at $477.38. A breakdown below this point would significantly raise the probability of an extended correction and weaken the current bullish wave structure. The broader Elliott Wave context suggests the current move remains part of a larger correction rather than a confirmed reversal - consistent with scenarios outlined in META Price Analysis: Correction Toward $399-$531 Zone, where a multi-leg corrective phase was projected within a wider cycle.
⬤ The chart underlines that the current structure may still be incomplete, leaving room for additional downside. Similar corrective behavior appeared in META Stock Bounces From $590-$610 Support Zone, where price reacted from a key support area before continuation. The reaction within the $500-$576 range and the behavior around the $477 level will ultimately determine whether META stabilizes or extends its decline - shaping broader sentiment across large-cap tech stocks.
 Marina Lyubimova


