 Marina Lyubimova

⬤ Meta Platforms shares are climbing again after a healthy pullback brought the stock down to a key support area. The recent chart shows META responding exactly as expected when it hit the Blue Box zone—a technical area that Elliott Wave traders watch closely for potential reversals. Price action in this $590-$610 range triggered the bounce that many technical analysts had been anticipating.
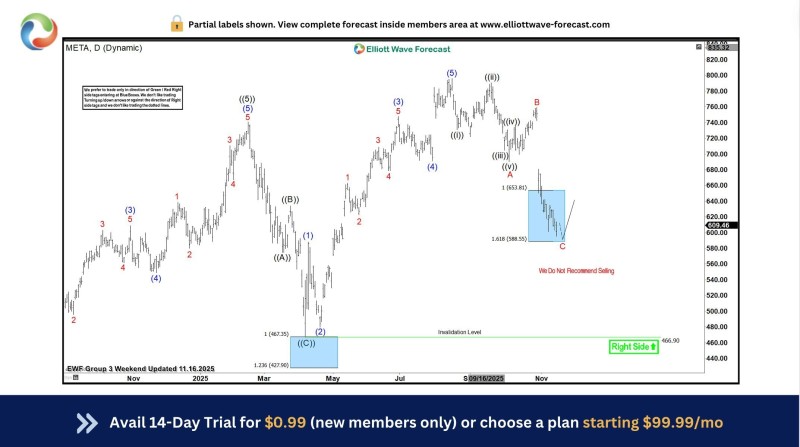
⬤ The chart reveals META finished off a classic A-B-C corrective pattern following months of strong gains. When shares dipped into that Blue Box between roughly $590 and $610, multiple Fibonacci levels lined up perfectly and selling pressure dried up. That's when buyers stepped back in, confirming this zone as a legitimate support area worth paying attention to within the bigger uptrend.
⬤ According to the Elliott Wave structure, the correction looks complete and META is now pushing higher from that low point. What's important here is that the stock never came close to threatening the critical $466.90 invalidation level, which keeps the larger bullish wave count intact. Remember, this pullback came after META had already rocketed past $800, so we're talking about a pause within a powerful trend, not a reversal.
⬤ Why does this matter for the broader market? Meta is a tech giant that moves the needle on sector sentiment and overall market direction. When stocks respect well-defined support zones like this, it often sets the tone for what comes next in the short and medium term. META's bounce reinforces how corrections work within healthy uptrends—they're normal, expected, and often set up the next leg higher. If the stock holds above these technical levels, it could influence momentum and sentiment across the entire large-cap tech space.
 Marina Lyubimova


