 Eseandre Mordi

Meta Platforms (META) is flashing technical warning signs as the stock repeatedly fails to reclaim a critical long-term trendline. Trading near $623, META has seen multiple rejection attempts at the 200-day exponential moving average, a level that historically separates bullish and bearish market regimes. With no confirmed breakout in sight, analysts are watching the $500 zone as the next major test.
Multiple Rejections at 200-Day EMA Signal Growing Resistance
META has failed repeatedly to hold above the 200-day EMA, cementing this trendline as a firm resistance zone. Historical data in the chart reveals that prior breakdowns below this level led to corrections of roughly 30% and, in the extreme case of the 2022 bear market, losses exceeding 73%.
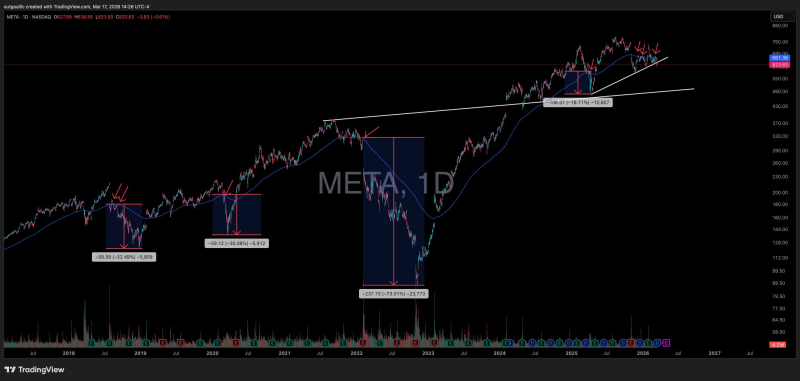
According to META stock rejection at the 200-day average, this pattern of failing to reclaim the EMA has consistently preceded prolonged consolidation beneath resistance. The current rejection reinforces the importance of this level as a key decision zone for price direction.
$500 Weekly EMA Is the Last Line of Defense Before Deeper Losses
If META cannot reclaim the 200-day EMA in the near term, the next meaningful floor sits near $500, defined by the 200-week EMA. That would represent a decline of approximately 20% from current levels. Broader market patterns, including stocks facing repeated EMA resistance across multiple asset classes, suggest that price reactions at major moving averages often define the next directional trend. Additional context from technical setups driven by key support zones shows META has been approaching oversold conditions near historically significant price-of-control levels.
The interaction between the 200-day and 200-week EMAs now defines the critical range for META. A confirmed move above the shorter-term trendline could shift momentum and attract buyers, while continued rejection keeps downside risk elevated. Until META reclaims its key moving average, the technical structure favors caution.
 Eseandre Mordi


