 Usman Salis

⬤Meta Platforms is under growing bearish pressure, with the stock trading around $613 after pulling back from recent highs. Technical indicators on the weekly chart point to fading momentum and multiple failed rebound attempts. Both analytical models tracking the stock remain bearish, with recent rallies looking more like traps than the start of any real recovery.
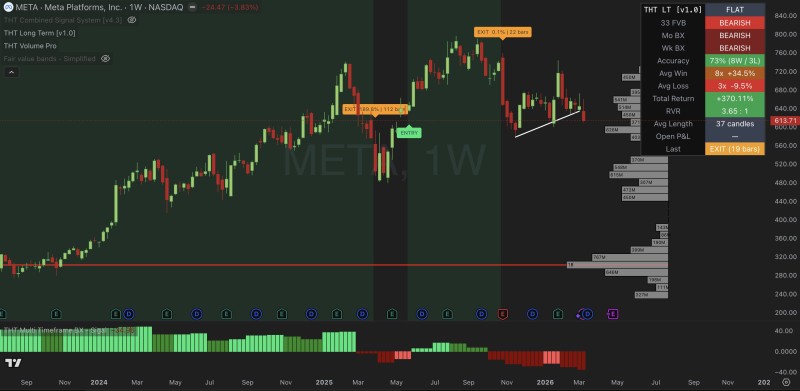
⬤The chart paints a consistent picture across timeframes. Monthly, weekly, and long-term indicators all sit in bearish territory, while the model's performance stats show around 73% accuracy based on 8 wins and 3 losses. META keeps trying to bounce, but every attempt fails to build into a genuine uptrend, which only reinforces the bearish setup already in place.
⬤The most critical level right now is a 626 million share volume block, a zone where heavy trading activity concentrated in a prior cycle. If META breaks below this support, the next logical target sits at $530, extending the current corrective phase. META Stock Analysis: Shares Reject 200-Day Average at $660, Retest Expected covers how resistance at key moving averages can set the stage for further downside when support fails to hold.
⬤That said, major support zones have triggered meaningful bounces before. META Stock Rebounds from Key Support Zone, Bulls Eye Higher Levels and META Stock Forecast: Pullback Nearing Key Support both show how META has reversed sharply from critical floors in previous cycles, with bulls stepping in to push the stock back toward higher ground.
⬤With bearish signals stacking across multiple timeframes, how META reacts around the current support zone will likely shape near-term direction. A clean hold could invite a bounce. A break lower opens the path to $530 and raises broader questions about momentum in large-cap tech.
 Usman Salis


