 Marina Lyubimova

Meta Platforms (META) is wrapping up what appears to be a routine pullback within its longer-term uptrend. According to Elliott Wave technical analysis, the stock has been retracing in a three-wave pattern after peaking near $809. This type of correction is considered healthy in bull markets and often sets up the next leg higher.
Where Things Stand
Recent analysis from Elliott Forecast projected META would pull back in three distinct waves, targeting a support zone between $716 and $670 before reversing course. That's exactly what's playing out now. The stock dropped from its $809 peak and is currently working through what technicians call Wave C—the final leg of this correction. The important takeaway here is that this is corrective movement, not a reversal of the uptrend. In other words, the bigger picture remains bullish, and this dip may actually present an opportunity rather than a warning sign.
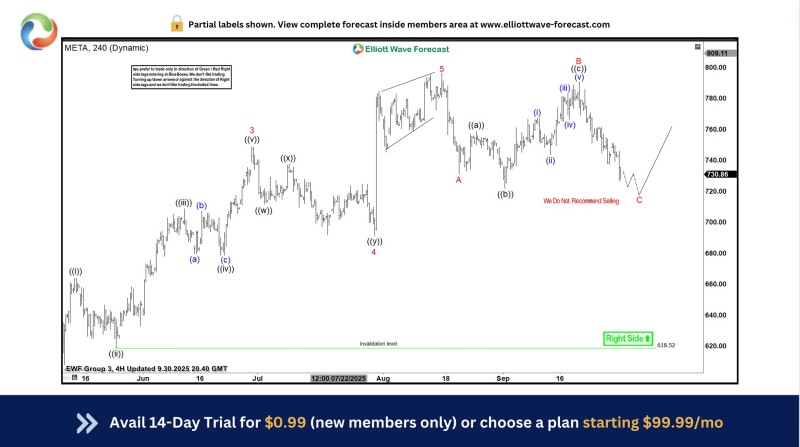
The key support zone sits between $716 and $670, a range that lines up with both Fibonacci retracement levels and previous consolidation areas where the stock found its footing before. If META holds this zone, the next move could target the $760 to $780 area, where the stock previously ran into resistance. The one scenario that would change the outlook would be a drop below $618, though that's not expected based on current technical structure.
What It Means for Investors
For anyone watching META closely, this correction might be worth paying attention to. If the stock stabilizes around that $716-$670 range, it could be a decent entry point for those looking to add exposure. Long-term holders shouldn't read too much into the pullback—it's a natural part of how markets breathe, especially after strong runs. Beyond the charts, Meta's fundamentals remain solid with continued strength in digital advertising, aggressive AI investments, and platform growth across Facebook, Instagram, and WhatsApp. That backdrop gives the technical setup more credibility and suggests any bounce from support has room to run.
 Marina Lyubimova


