 Artem Voloskovets

⬤ Meta Platforms Inc. (META) shares hit resistance at the 200-day moving average during the latest session, a level closely watched by traders. The rejection at this technical benchmark highlights strong overhead pressure and puts focus on whether the stock will retest this key zone. META is currently trading in the mid-$660 range after retreating from recent highs.
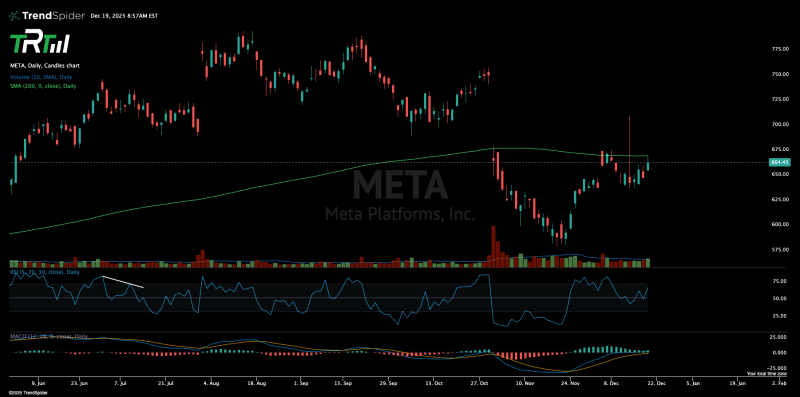
⬤ The daily chart shows how META's rebound came to a halt right at the 200-day simple moving average, a line that often separates bull markets from bear markets. Instead of breaking through, the stock went sideways just beneath this level, showing buyers aren't ready to push higher yet. Trading volume stayed fairly normal during the pullback, which suggests this was more about technical levels than heavy selling pressure.
⬤ Momentum readings add more detail to the picture. The relative strength index sits in neutral territory, meaning the stock isn't overbought or oversold right now. Meanwhile, the MACD histogram has been climbing from negative levels, with the MACD and signal lines getting closer together but not yet crossing over in a bullish way. These indicators suggest META could keep consolidating or carefully retest the 200-day average rather than making a sharp move in either direction.
⬤ What happens at the 200-day moving average matters for the broader tech sector given META's size and influence. If the stock successfully retests and reclaims this level, it could signal a return to a longer-term uptrend. If it fails and confirms the level as resistance, META may stay range-bound. Either way, this technical setup will likely shape how traders position themselves in the coming sessions.
 Artem Voloskovets


