 Alex Dudov

IREN Limited is showing signs of growing technical weakness as key indicators begin aligning to the downside. A chart shared by TheGentleTraveler points to fading momentum across multiple timeframes, with traders now watching whether the current structure opens the door to deeper losses.
Momentum Signals in IREN Turn Negative Across Timeframes
The chart highlights a clear shift in momentum, with both daily and weekly signals flashing bearish conditions. The appearance of repeated Triple Pink Diamonds suggests a deterioration in trend strength, reinforcing the idea that upside momentum is running out of steam.
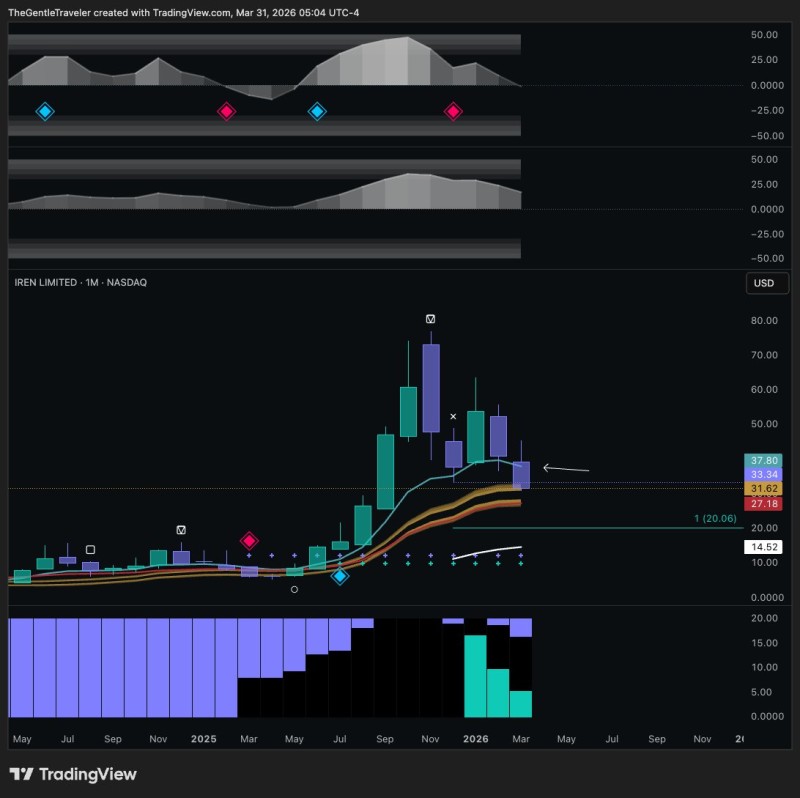
The monthly timeframe is showing early signs of weakness, with price closing below the monthly 8 EMA - a key signal indicating that longer-term trend support may be slipping.
At the same time, the monthly timeframe is showing early signs of trouble. Price appears to be closing below the monthly 8 EMA, indicating that longer-term trend support may be giving way. This alignment across timeframes is worth noting - it often reflects a broader structural shift rather than a routine short-term fluctuation.
The $20 IREN Price Level Comes Into Focus
One of the key levels now on traders' radars is the $20 zone, tied to a 1:1 measured move. This level is specifically highlighted in the chart as a potential downside target if the current structure continues to play out.
The mention of gap filling also suggests that price inefficiencies from earlier moves could act as magnets during a decline, increasing the probability of a deeper retracement. Recent technical coverage reflects similar fragility - IREN Stock Rejected at $40 Bull Market Support Band notes that failure to reclaim key levels has kept the stock under pressure, with resistance forming exactly where support once held.
If bearish signals continue to dominate without a reversal, lower levels toward $20 could stay in play for IREN - unless momentum finds a reason to shift.
A Structure That Reflects Weak Follow-Through in IREN Stock
The broader structure shows a transition from strong upside expansion into a cooling phase. While the chart does not confirm a full breakdown, it does highlight a clear lack of sustained bullish follow-through. This type of behavior has been observed in other recent setups - IREN Limited Eyes $145 and $215 Price Targets in a Multiyear Breakout Setup captured the earlier rally, while the current picture tells a different story.
The combination of weakening momentum signals and failure to reclaim higher ground reinforces the view that IREN is currently working through a corrective phase.
The Signal Traders Are Watching Closely
The key question now is whether bearish signals continue to dominate or begin to reverse. Any return of bullish Blue Diamond signals would be critical in shifting sentiment and restoring confidence in the upside case.
For now, IREN remains under pressure, with the technical structure pointing toward continued caution. As covered in IREN Stock Analysis: $43 Support Holds as $100+ Target Remains in Play, longer-term targets remain on the table - but getting there requires the stock to first stabilize and reclaim lost ground.
Any return of bullish signals would be the first sign that sentiment is shifting - until then, the path of least resistance remains lower.
Unless momentum improves meaningfully, the chart continues to suggest that lower levels - potentially toward $20 - remain a realistic scenario for IREN in the near term.
 Alex Dudov


