 Eseandre Mordi

⬤ IREN is moving toward a critical technical support level after confirming a bearish pattern on its daily chart. The stock triggered a bear flag breakdown late Friday, placing price close to its 200-day moving average. IREN closed around $36.70, just slightly above that long-term trend indicator, while traders now focus on the $33–$34 support zone below. Earlier setups were covered in IREN Stock Compresses in Wedge Pattern as $60–$70 Breakout Approaches.
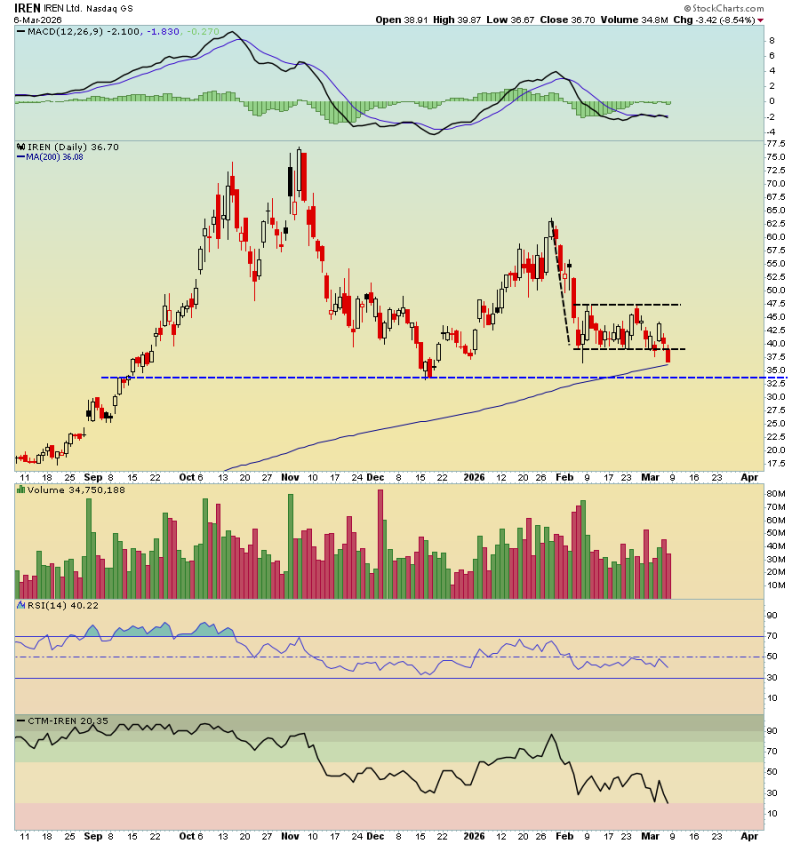
⬤ The recent decline follows a broader pullback from February highs near the mid-$50 range. After that drop, IREN formed a downward consolidation that closely resembles a classic bear flag. When price breaks below the lower boundary of these patterns, it tends to signal continuation of the prior decline. That move has now pushed the stock toward its 200-day moving average near $36, a level closely watched as a key long-term trend marker. Prior momentum concerns were flagged in IREN Stock Shows Weakness: 700% Rally Stalls Below Key Resistance.
⬤ Technical indicators are flashing caution across the board. The MACD has crossed into negative territory and the RSI is sitting in the lower half of its range, pointing to reduced buying pressure. The $33–$34 zone is now the most important level to watch, identified by traders as major long-term support. Earlier price action around similar declines was analyzed in IREN Stock Drops to $43 After Losing Key Support, Eyes $36 Level.
⬤ An additional wildcard is Oracle's upcoming earnings release. Market participants often track related technology and infrastructure names during major enterprise cloud announcements, and any surprise in Oracle's results could stir volatility across the sector. With IREN sitting at a technically sensitive level, how it holds or fails around $33–$34 support will likely set the tone for its next directional move.
 Eseandre Mordi


