Saad Ullah

IREN stock is drawing attention after reclaiming momentum near a key technical zone, with price pushing above a descending trendline following weeks of compression. The move highlights a possible shift in structure as buyers step back in after a controlled pullback phase. Analyst Enrich Trades highlighted the setup as one of the most attractive weekly charts, noting clear strength on the daily timeframe as well.
IREN Compression Phase Near Key Support
The chart shows that after peaking near the $70-$75 region, IREN entered a steady pullback marked by a sequence of lower highs. A clear descending trendline formed, guiding price lower toward a horizontal support zone around $30-$35.
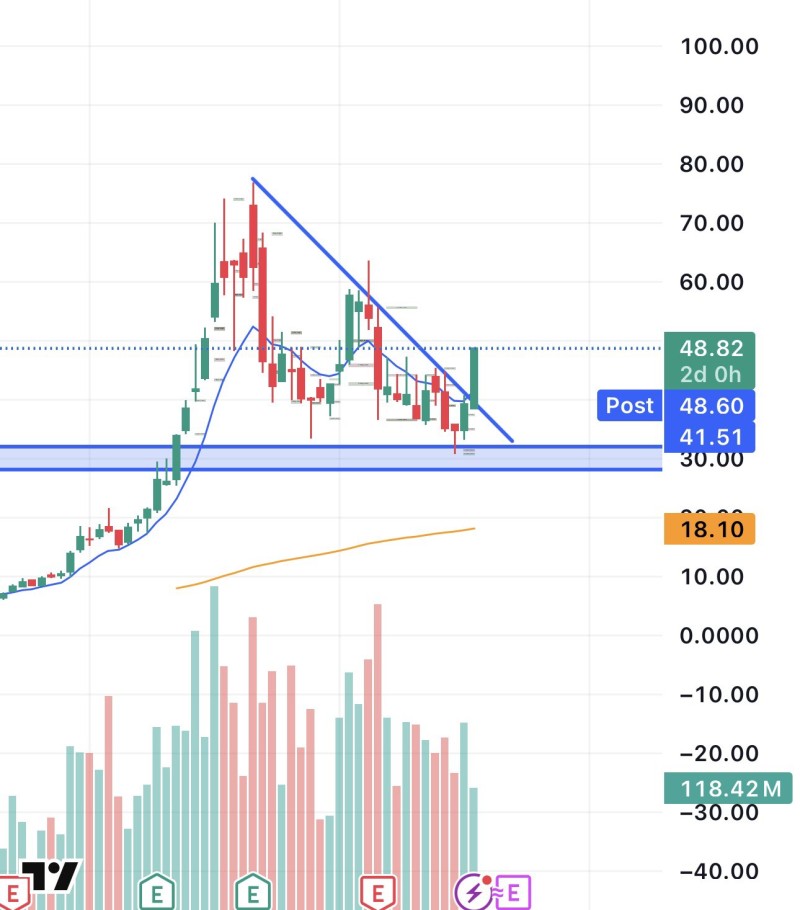
This support area held multiple times, preventing a deeper breakdown and establishing a base. Price action became increasingly compressed between falling resistance and stable support - a classic tightening structure that traders often watch closely.
The setup stands out as one of the most attractive weekly charts right now, with daily timeframe strength backing the move.
IREN Breakout Attempt at $45-$50 Resistance
The latest move shows IREN pushing above the descending resistance line, accompanied by a strong daily close. The breakout level around $45-$50 is now critical. This zone previously acted as resistance during the consolidation phase and is now being tested as potential support.
Holding above it would confirm a shift away from the prior downtrend structure. Recent coverage has also highlighted how IREN rebounds tend to attract momentum-driven interest - as seen in IREN stock surges 75% as momentum indicators flash green, where strong upside phases developed after a period of stabilization similar to the current setup.
Price compression between falling resistance and stable support is one of the clearest pre-breakout structures in technical analysis.
IREN Structure Improves But Trend Reversal Not Yet Confirmed
While the breakout is technically significant, the broader structure still reflects a recovery phase rather than a confirmed trend reversal. Prior moves toward resistance zones - such as in IREN stock nears $63 resistance as weekly rally continues - demonstrate how key levels often dictate whether momentum accelerates or stalls.
- The prior sequence of lower highs has been challenged but not fully invalidated
- Price is rebounding from a well-defined base near $30-$35
- The move above resistance suggests improving momentum, not full confirmation
This type of setup often transitions into either continuation or renewed consolidation depending on follow-through. Earlier price action also showed how quickly sentiment can flip, as seen in IREN stock jumps 49% in one month, where sustained buying pressure followed a base formation similar to the current setup.
A breakout above a descending trendline shifts short-term control toward buyers - but only sustained follow-through validates the move.
Momentum Builds Into a Decision Zone
The current structure places IREN in a transition phase. The breakout attempt shifts short-term control toward buyers, but confirmation depends on whether price can hold above the reclaimed level and build a higher low.
Failure to hold this zone would likely return the stock to consolidation within the prior range. Sustained strength, however, would open the path toward retesting higher resistance zones. For now, the chart reflects improving conditions - but the next move will determine whether this is a continuation signal or just another pause within a broader range.
 Saad Ullah