 Usman Salis

⬤ IREN keeps pushing higher on the weekly chart after bouncing sharply from its latest dip. Price is now closing in on a clear resistance zone around $63. The stock has recovered strongly after reclaiming its rising trendline and climbing back above important moving averages. That recent pullback gave traders a solid entry point—now everyone's watching to see what happens at this overhead level.
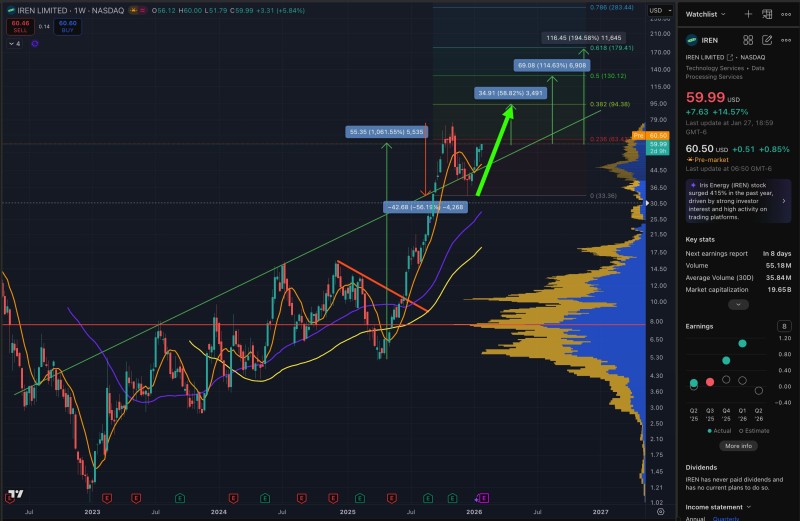
⬤ The chart shows IREN moving inside a long-term rising channel that's been steering the price since 2024. After hitting support near the lower edge of this trend, the stock shot higher and cleared several resistance points along the way. Fibonacci levels put near-term resistance around the 0.236 mark in the low $60s, which lines up perfectly with where the stock is trading now—and where sellers might start showing up.
⬤ Even with strong momentum behind it, IREN is entering tricky territory. The $63 zone is a level the stock hasn't held before. If it can push through and hold above this area, the uptrend should keep going. If it gets rejected, we might see some sideways action or a breather—though that wouldn't necessarily kill the bullish setup. Volume data shows plenty of activity below current prices, which suggests there's a solid foundation underneath.
⬤ This moment matters because it's a major decision point inside an established uptrend. How IREN handles this resistance will shape what comes next—either another leg higher or a short-term pause to digest recent gains. What happens here will set the tone for momentum and sentiment around the stock's ongoing move.
 Usman Salis


