Alex Dudov

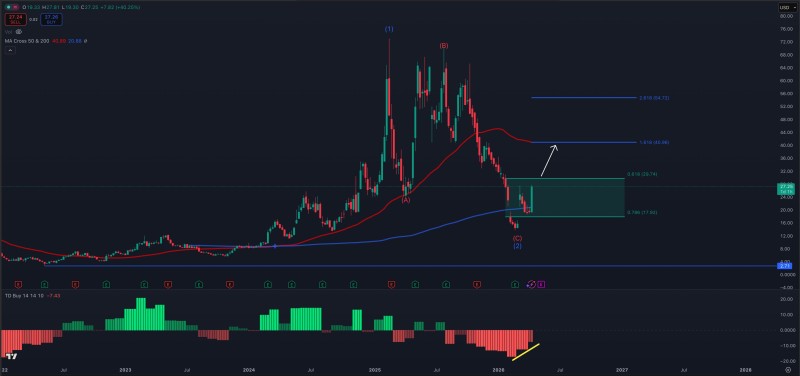
Something is shifting in HIMS stock. Price action is breaking away from its prior downtrend, and the chart is starting to tell a different story. StockTrader_Max pointed out that the stock has printed a higher high and is now targeting the 1.618 Fibonacci level near $40 - a zone that also lines up with the 50-week moving average.
The stock has printed a higher high and is now targeting the 1.618 Fibonacci level near $40, a zone that also aligns with the 50-week moving average.
HIMS Stock Structure Shifts After Higher High
For months, the chart was defined by a familiar and painful pattern - lower highs, sustained downside pressure, and a seller-driven structure that offered little relief. That kind of price action is typical of a corrective phase, and HIMS was stuck deep in one.
Now something has changed. The stock has printed a higher high, and that single development breaks the sequence that had been in place. In technical analysis, this is not a minor detail - it signals that the sellers who had control may be losing their grip. It does not confirm a full trend reversal on its own, but it does establish the first condition for one. That matters.
HIMS Stock Breaks $26 Gamma Wall as Dealer Hedging Drives Move - an earlier phase of this same recovery story, where price first started running into dealer-driven resistance.
Why $40 Is the Key HIMS Price Target
The $40 level is not arbitrary. Two independent technical factors converge there, and that overlap is exactly what makes it worth watching:
- The 1.618 Fibonacci extension level sits near $40
- The 50-week moving average is positioned in the same area
When two significant levels land in the same zone, the market tends to treat that area seriously - either as a magnet pulling price in, or as a wall that requires multiple attempts to break through. For HIMS right now, $40 represents the next real decision point.
This overlap creates a high-interest zone where price is likely to react - a potential area of resistance and decision rather than a guaranteed target.
Earlier this year, HIMS Stock Jumped 40% After Hours as $27-$31 Price Targets Emerged, giving the first real indication that demand was returning to this name.
TD Indicator Signals a Possible HIMS Momentum Shift
Beyond the price structure, the chart also shows the TD indicator sitting in light red territory. According to the analysis, this opens the door for a potential flip toward a bullish phase if momentum follows through. It is a condition, not a confirmation - but combined with what price is doing, it adds weight to the setup.
HIMS has been stabilizing after a steep correction and is beginning to show early recovery signals. The combination places it in a transitional state: enough bullish evidence to pay attention, but not enough to call the move confirmed.
The TD indicator in light red territory suggests the possibility of a shift toward a bullish phase if momentum flips.
It is worth noting that HIMS Stock Faces Little Resistance Until $30 as Price Stabilizes Near $15 - that open path between current levels and $30 gives the setup room to develop before hitting heavier supply.
What Comes Next for HIMS Stock
The current picture is one of a stock moving away from its corrective phase without yet committing to a new trend. The higher high changes the framework. The $40 confluence defines the next major test. And the TD setup adds a timing element that is worth monitoring.
If HIMS continues building upward, the key question will be how price reacts when it reaches that $40 zone. Whether it stalls there, consolidates, or pushes through will tell investors a great deal about the durability of this recovery. For now, the transition is underway - and the next few weeks will determine whether it has legs.
 Alex Dudov