 Artem Voloskovets

HIMS has been one of the more dramatic stories in the health-tech space this year. After trading above $60 earlier in the cycle, the stock has shed the majority of those gains over several months of sustained selling. Now trading near $15.70, price action is starting to show signs of stabilization, and the technical picture raises an interesting question: if buyers return, how far could HIMS run before hitting meaningful resistance?
HIMS Consolidates Near $15 After February Selloff
The February decline was particularly intense, with several consecutive red candles dragging HIMS from the upper $20s into the mid-teens. As HIMS stock tests a critical 2021 support level following the sharp decline, analysts have pointed to this zone as a major technical floor that has historically attracted buyers. The pace of selling has visibly slowed in recent sessions, with the stock forming a tighter consolidation base around current levels.
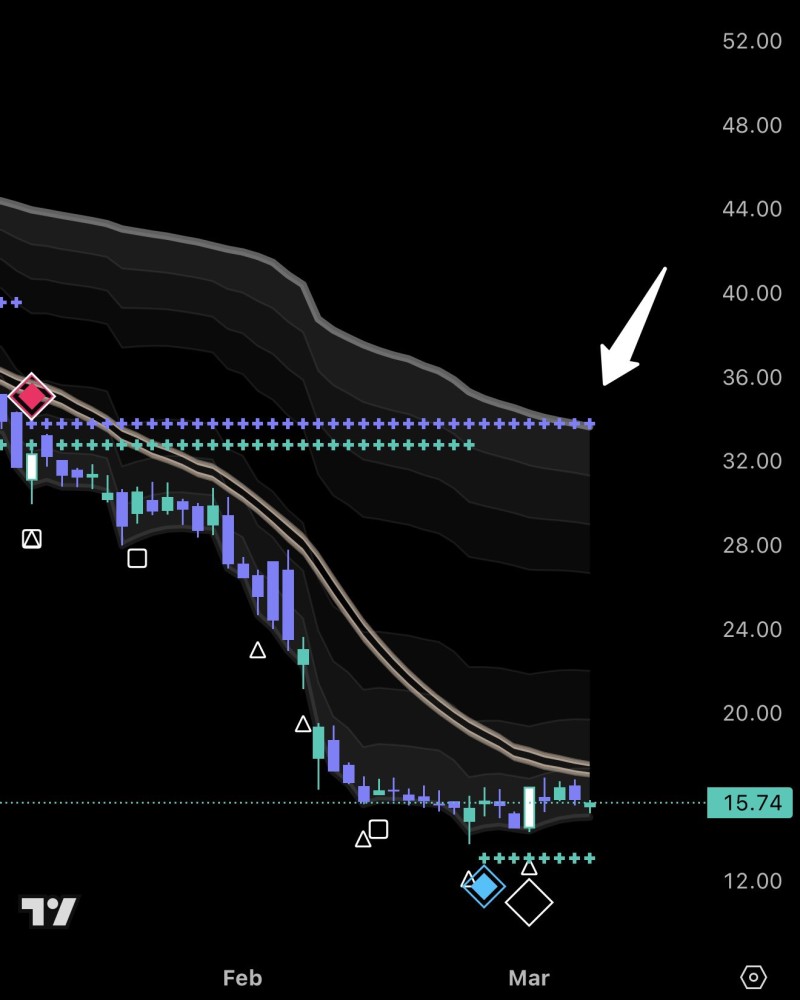
Price remains below major moving averages and inside declining volatility bands, both of which reflect the broader bearish trend still in play. At the same time, the stock is pressing into a support area that carries significance going back to 2021 levels. Whether that floor holds will be the key question in the sessions ahead.
Resistance Near $30 Sets the Range for a Potential Recovery
What makes the current setup technically notable is the relative lack of overhead supply between $15 and the low-to-mid $30s. Hims & Hers Health tests $15.75 support after a 5-month decline, with chart analysis pointing to a critical technical floor after extended selling pressure. Dotted resistance markers on the chart align near the $30 region, where prior consolidation areas and moving average clusters converge. That implies a potential path of relatively unimpeded movement if momentum flips, before heavier resistance becomes a real factor.
Still, the dominant trend has not reversed. HIMS remains in a distribution phase following its earlier highs, and HIMS stock is oversold with support at $15 and $13.60, with traders watching closely whether the current base can hold. The $13.60 level below represents the next meaningful technical floor if current support gives way. For now, the stock sits at a decision point, and the coming sessions may define whether this is the start of a real base, or simply a pause before further downside.
 Artem Voloskovets


