 Usman Salis
⬤ Hims & Hers Health Inc. (HIMS) is sitting at a make-or-break technical level after a recent pullback, with the stock holding steady above a solid long-term support zone on the two-week chart. The $27 level—which used to act as resistance before the last breakout—is now serving as a floor, and that's keeping the bullish case intact.
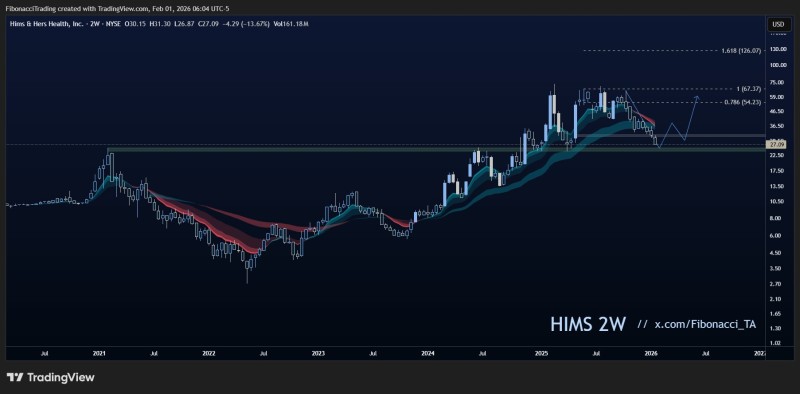
⬤ The chart shows HIMS cooled off after a strong rally, but the overall trend structure hasn't broken down. Moving average bands are still sloping upward, which suggests the dominant trend is still pointing higher rather than reversing course.
⬤ If momentum picks back up, the chart points to potential upside targets around $54 and $67 based on Fibonacci extensions, with a longer-term zone near $126. The key here is that the stock is consolidating above support—not breaking below it—which keeps the bullish setup technically valid.
⬤ This phase matters because how a stock handles former breakout levels often decides whether a pullback turns into another leg higher or a deeper correction. HIMS holding current levels keeps the long-term uptrend intact and preserves bullish momentum. With price consolidating instead of collapsing, the stock is positioned for a clearer directional move in the coming weeks.
 Usman Salis


