 Usman Salis
⬤ HIMS shares have dropped considerably from their recent highs and are now finding their footing at a technically significant support area. According to @StockTrader_Max, the stock is trading near its 2021 highs—a zone that previously served as major resistance before the recent breakout and subsequent decline.
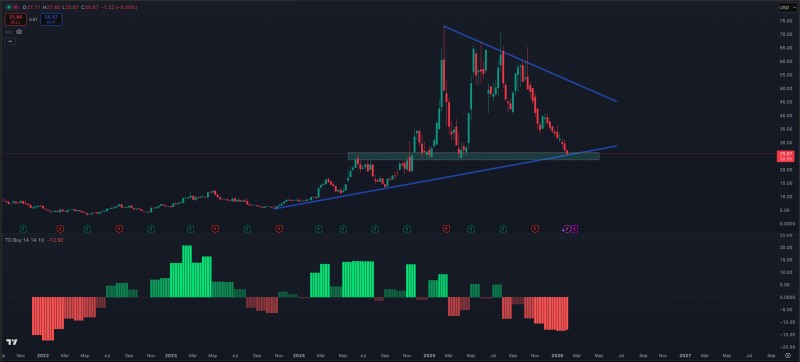
⬤ The chart reveals HIMS returning to a clearly defined support band that lines up with former resistance and an upward-trending long-term trendline. This area has historically drawn buying interest, making it essential for price stability. Despite the aggressive downward movement, the price is still holding above this support zone, suggesting sellers haven't yet managed to push through decisively.
⬤ Momentum indicators below the price chart show deeply oversold conditions after the recent selloff. The extended stretch of negative readings highlights how intense the pullback has been and suggests selling pressure may be stretched thin at these levels. Past instances of similar conditions have often coincided with price pauses or consolidation rather than immediate further drops.
⬤ This juncture matters for anyone watching HIMS stock analysis, as how the price behaves around this support zone could shape what comes next. If this level holds, the broader technical structure stays intact. If it breaks down convincingly, downside risk increases. With the price compressed at a long-term technical level and momentum oversold, the next few sessions will likely be pivotal in determining near-term sentiment around HIMS.
 Usman Salis


