 Marina Lyubimova

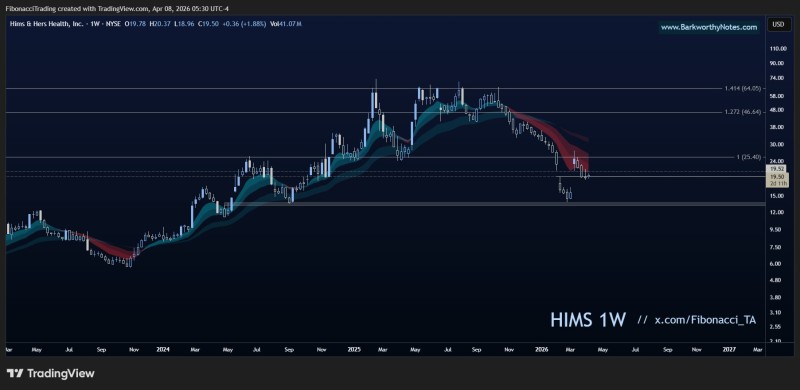
Hims & Hers Health is stabilizing after a significant decline, with price now hovering around a critical technical level that could define what comes next. Fibonacci_TA on X highlights the focus on whether the stock can secure a weekly close above $19.50 - a move that would signal early strength within a potential recovery structure.
A weekly close above $19.50 would indicate that buyers are beginning to reclaim control
The $19.50 Level That Now Defines HIMS Setup
The chart clearly marks $19.50 as the key pivot. Price is currently consolidating around this level after a decline from prior highs, making it the immediate line separating weakness from potential recovery.
Until the stock closes a weekly candle above this zone, price remains in a neutral phase, still influenced by the broader corrective structure. Buyers haven't demonstrated enough conviction yet - this level is where that changes, or doesn't.
HIMS Higher Low Still Needs Confirmation
The primary idea here is not a confirmed bullish trend, but the formation of a higher low. Price has pulled back significantly and is now attempting to base above a broader support region. This phase is critical - without a confirmed higher low, market structure simply cannot transition into a sustained uptrend.
Recent price action suggests stabilization, but confirmation remains pending. As the analysis notes:
Price has pulled back significantly and is now attempting to base - this phase is critical before any transition into a sustained uptrend
Context matters here. HIMS stock previously faced little resistance until the $30 level as it stabilized near $15, which gives the current consolidation zone more technical significance than it might appear on the surface.
EMA Cloud Retest as the Next HIMS Milestone
The analysis points to a likely retest of the EMA cloud as the next phase, followed by a possible breakout. However, this scenario depends entirely on first establishing the higher low and reclaiming $19.50.
This creates a clear sequence:
- Higher low formation
- Weekly close above $19.50
- Retest of the EMA cloud
- Potential breakout above it
Until the first condition is met, the rest of the structure remains conditional. Each step builds on the one before it - there are no shortcuts in this setup.
The breakout scenario only opens up after reclaiming $19.50 and retesting the EMA cloud - everything else is conditional on that sequence playing out
HIMS Stock Structure Remains in Transition
The chart reflects a market attempting to recover, but not yet confirming a reversal. HIMS has experienced significant volatility in recent months, including sharp drawdowns and rebound attempts, with technical levels continuing to guide sentiment. Short squeeze speculation previously fueled a HIMS rally backed by 40% revenue growth, showing the stock is capable of sharp moves when conditions align.
More recently, HIMS price prediction models target $130 as Wave 2 nears its end, reinforcing that longer-term bulls are still watching this name closely despite the near-term uncertainty.
For now, HIMS remains in a transitional phase - with $19.50 acting as the first meaningful signal that momentum may be shifting back in favor of buyers.
 Marina Lyubimova


