 Marina Lyubimova

HIMS has entered a critical technical zone as shares test multi-year support levels following a prolonged downtrend. After plunging from previous highs above $60, the telehealth stock now hovers around $15.13, positioning itself at what analysts view as a decisive inflection point. The weekly chart reveals sustained selling pressure, with consecutive red candles pushing price toward floors not seen in years. Investors are closely monitoring whether this support zone will hold or if further downside awaits the struggling healthcare name.
HIMS Tests Critical $14.50-$15 Support Zone After Extended Selloff
Hims & Hers Health is approaching a significant support area near the $14.50-$15.00 zone after sharp losses from its previous highs. The weekly chart illustrates a prolonged downtrend, with price recently around $15.13, down notably from levels above $60 in prior periods. The current focus remains on finding support and watching for a potential bounce now that price is testing this area. Chart annotations show a lower horizontal support line in that zone, reinforced by the weekly action that has followed consecutive declines.
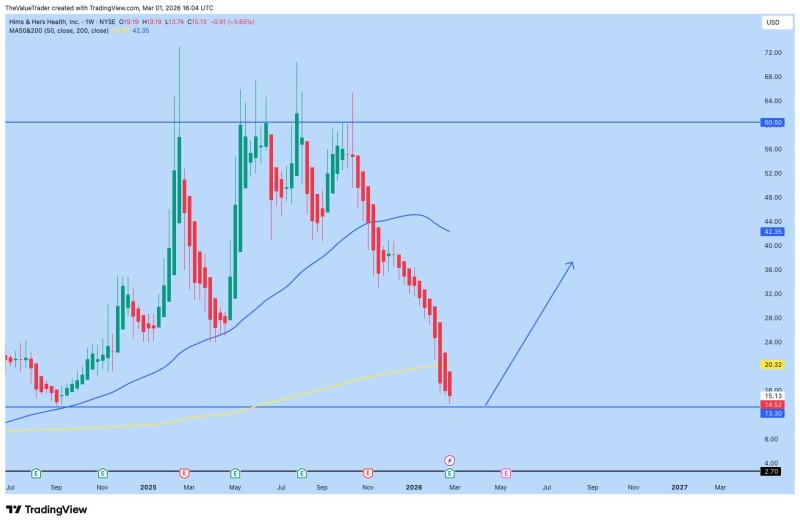
On the weekly timeframe, HIMS has printed a series of red candles, reflecting persistent selling pressure that has brought price toward multi-year lows. The stock's decline has crossed below both the 50-week moving average near $42.35 and the broader trading range that dominated in prior years. HIMS Stock Oversold With Support at $15 and $13.60 analysis shows the stock has been testing critical support levels recently, as technical indicators signal continued weakness around these floors. This aligns with broader technical coverage that repeatedly highlights oversold conditions and key pivot zones as HIMS works to stabilize.
Price Action Signals Potential Inflection Point at Multi-Year Lows
The decline toward this support follows a protracted selloff from mid-range distribution and peaks near $60, with several reports noting technical headwinds and momentum favoring further downside in the absence of relief rallies. Chart structure reflects how successive lower highs and lower lows have characterized the trend, and price is now near levels once seen as significant floors during earlier cycles. Hims & Hers Health Tests $15.75 Support After 5-Month Decline highlights the extended nature of this selloff and its approach toward established technical floors.
Additional analysis has pointed to the possibility of deeper tests below current support if sellers maintain control, suggesting that the $13.5 region could see attention next. HIMS Stock Slides Toward $13.5 Support as Downtrend Deepens examines potential scenarios if the current floor fails to hold.
How HIMS reacts around this multi-year support zone may help define the next phase of its price action. If this floor holds and a corrective rebound materializes, it may signal that selling pressure has exhausted near these levels, setting up a consolidation or reversal pattern. Conversely, a decisive breakdown below these floors would reinforce the prevailing downtrend and potentially extend pressure toward deeper support bands. Given the stock's trajectory from earlier peaks, the current area serves as an important technical decision point that could influence broader sentiment around this telehealth name in the near term.
 Marina Lyubimova


