 Sergey Diakov

⬤ GOOGL bounced sharply from the $234-223 support zone marked on the chart. That reaction lined up perfectly with the expected wave pattern and let traders move their long positions into risk-free territory. The stock climbed steadily toward $320 as momentum picked up through early December.
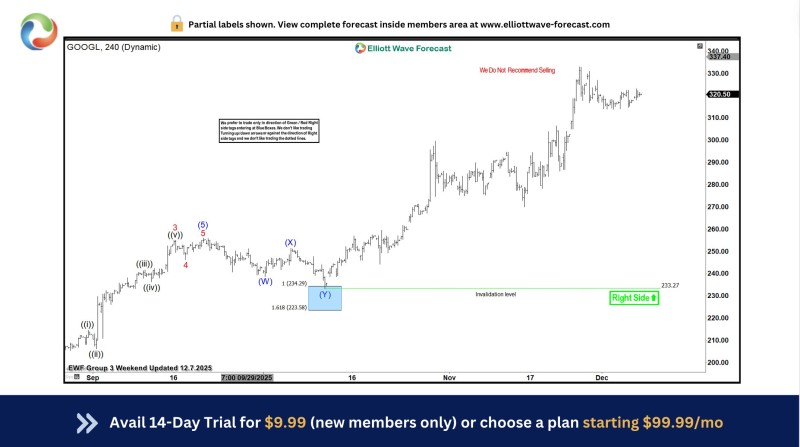
⬤ The chart shows a completed W-X-Y corrective pattern finishing right at the support zone. Price stayed comfortably above the $233 invalidation level, keeping the bullish outlook alive. From there, GOOGL built higher highs through November and December, proving the support area was the real deal.
⬤ Market action shows buyers stepped in exactly where the technical structure suggested they would. The strong bounce prevented any deeper pullback and confirmed that traders were watching those same levels. The stock's behavior matched the directional forecast almost perfectly.
⬤ This matters because holding that support zone kept GOOGL's upward momentum going at a critical technical point. Staying above major structural levels keeps the focus on further upside and supports a positive outlook as the stock moves through its current trend phase.
 Sergey Diakov


