 Marina Lyubimova

⬤ AST SpaceMobile gave back its recent gains this week, continuing a pullback from recent highs as weekly candles closed near support channels. The stock attempted to break above long-term resistance levels but got rejected repeatedly, leaving it exposed to additional downside risk. The weekly chart shows the space broadband player struggling after a broad rally, with price action failing to secure higher ground above key technical layers.
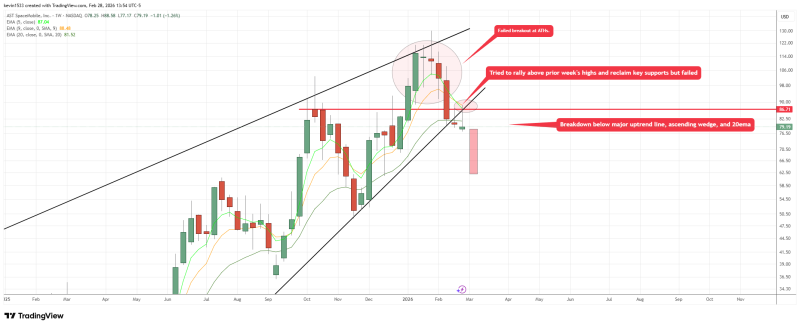
⬤ From a technical standpoint, ASTS recently tested resistance zones from previous highs before sellers took control. The chart reveals a break below a short-term rising trendline and rejection at the top of its range, pointing to weakening demand. Volume patterns and momentum indicators show fading bullish conviction, matching repeated failures to reclaim resistance. The stock slipped into the late $70s price range, based on current market data.
⬤ Despite the recent weakness, ASTS still maintains structural patterns similar to earlier 2025 consolidation phases. "The failure to sustain breakout strength from earlier zones implies that the current move lower could extend further," according to technical analysis. However, the inability to hold above breakout levels suggests a deeper retracement ahead. AST SpaceMobile's momentum has cooled compared to its earlier climb driven by satellite deployment news.
⬤ ASTS' failure to maintain bullish reversals and the rejection at critical technical resistance levels highlight a broader struggle to sustain upward moves. Continued pressure around these zones may reinforce caution and shift focus toward downside targets if the stock can't regain its trend structure. This technical setup matters as broader sentiment in space-related stocks and speculative growth plays faces increasing scrutiny based on price action and trend consistency.
 Marina Lyubimova


