 Marina Lyubimova

As the structure of the data shows, the situation is clear when the user avoids “bull vs bear”.
At this time participants are supporting the market rather than buying with conviction. There is a flow of call options into the closest expiration date totaling approximately $925 000. In many cases this indicates that a participant is protecting the $90 price level instead of predicting a price increase. By managing gamma, covering short positions or hedging, market makers and traders create this type of flow. According to data from Tradytics that was noted by Fibby, “this heatmap is a battlefield” and short term call options are attempt to maintain the current price.
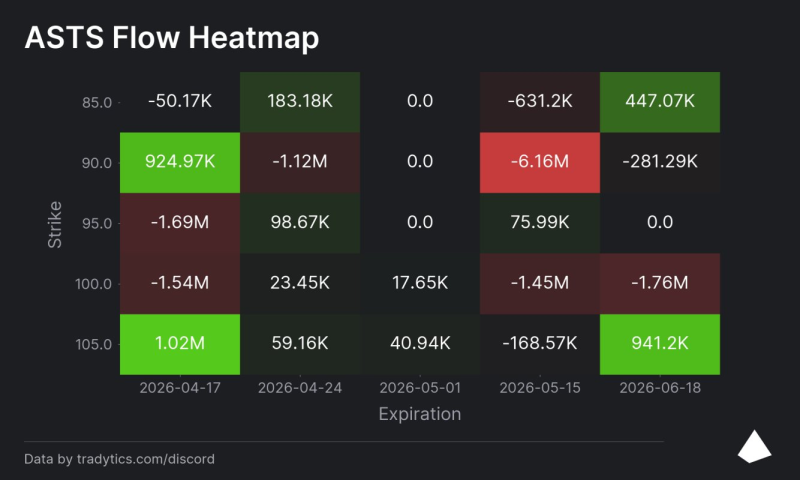
For those reasons, the data is not indicative of a price increase. The situation is described as: “we’re not letting it drop yet”.
When the focus shifts to May 15, the data changes - there are put options worth negative $6.16 million, which represents a deliberate financial position. As Fibby stated, “that is the largest single cell on the grid”, which shows that bearish positions are the most prominent part of the current options structure. If a large amount of capital is in one expiration date, it often means that there is a specific event coming or that traders believe price support will end after the current date.
It is important to note that the situation is stable now but this stability is temporary. On the $100 strike price, put options are increasing for May besides June at values of negative $1.45 million and negative $1.76 million. As autor mentioned, “$100 puts are stacking too”, which supports the theory that a target area for lower prices is developing. Because of this concentration, the activity is a specific target rather than general hedging. If the price begins to decline, the market anticipates that the price will move toward the levels.
But there is also activity on the side of price increases - in June, there are $105 call options worth about $941 000 - those are smaller in value and set for a later date, which means that expectations for a price increase exist but they are late and weak when compared to the positions for a price decrease.
As Trader asked, “holding the line or the calm before the drop?”, which describes the uncertainty in the current market. To summarize the structure is a timeline where the $90 level is protected now but support may become weak after expiration. In the medium term, positions that profit from a price drop are more common.
By observing the $90 level, traders can find the primary indicator for future movement. If the price stays above this level, the stock may remain in a narrow range and put options will lose value. If the price falls below this level, the decline can happen fast because the necessary positions are already present.
To conclude the market has support in the short term but the flow of options shows that traders are preparing for the price to move lower after the current support ends.
 Marina Lyubimova


