 Usman Salis

AST SpaceMobile is pulling back again - but the bigger picture hasn't changed. According to Fibby., on the 2-week chart the stock is still printing a clear sequence of higher highs and higher lows since its 2024 breakout. What looks alarming on a daily timeframe is just another correction inside a functioning uptrend.
ASTS Fibonacci Zone: $71 to $80 Holds as Key Support
After peaking near the $90 to $100 region, ASTS has pulled back into the 0.5 to 0.618 Fibonacci retracement zone, landing roughly between $71 and $80. This isn't new territory - the same zone was flagged in AST SpaceMobile Holds $70-$80 Buy Zone, Eyes $130 Target as a structural support level. So far, the zone is doing its job.
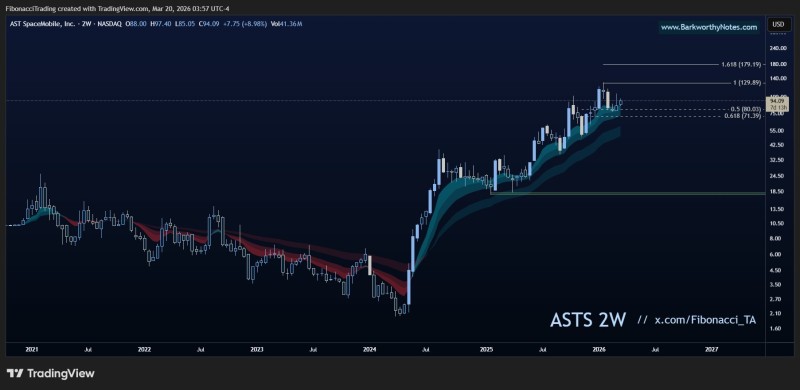
This isn't the first time ASTS has scared investors with a deep correction. The stock has already seen drawdowns approaching 50% during its uptrend - and recovered every time. As covered in AST SpaceMobile: 2024 Pattern Shows Pullbacks Leading to New Highs, these sharp drops are a defining feature of this stock, not a sign the trend is over.
ASTS Weekly Trend: Rising Channel Structure Still Intact
Zoom out to the weekly chart and the structure holds. ASTS continues to trade inside a rising channel, with price respecting both the upper and lower bounds through multiple swings. AST SpaceMobile Holds Rising Channel Near $82 Ahead of Earnings confirmed this channel framework remains intact heading into the latest consolidation phase.
ASTS is volatile, and that's unlikely to change. But volatility without a trend breakdown is just noise. Until the rising channel and Fibonacci support give way, the bias stays bullish.
 Usman Salis


