 Saad Ullah

⬤AST SpaceMobile is back on traders' radar after pulling back roughly 40% from its recent high near $129. The weekly chart shows the stock settling around the 0.5 Fibonacci retracement level at $80, where buyers have started showing up. According to AST SpaceMobile Holds $70-$80 Buy Zone, Eyes $130 Target, this kind of deep retracement has been a recurring feature in ASTS price action, typically setting the stage for the next leg higher.
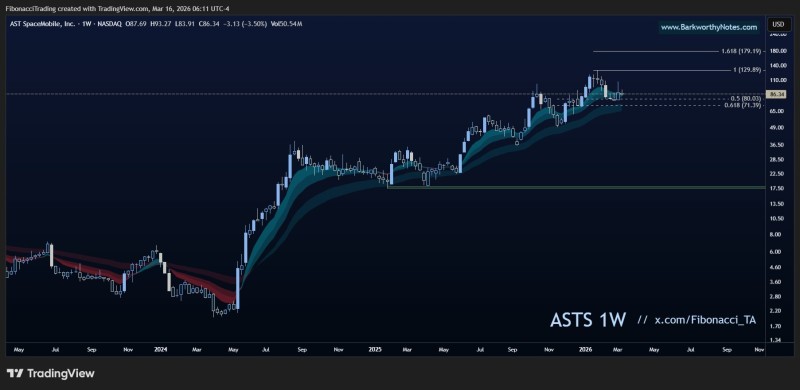
⬤The $70-$80 zone carries particular weight because it combines two significant Fibonacci levels: the 0.5 retracement near $80 and the 0.618 level near $71. Technical analysts treat these overlapping areas as high-probability support regions, especially in stocks with a history of trend continuation after corrections. ASTS fits that profile, with a pattern of powerful rallies followed by corrective phases that pull in fresh demand before the next expansion.
⬤The bullish case stays intact as long as ASTS holds above the Fibonacci support zone. If the price firms up here, the path toward the previous high near $129 reopens as the next major resistance. This condition was also flagged in ASTS Stock Tests $98 Level as AST SpaceMobile Holds Rising Wedge, where analysts noted that maintaining higher lows in the weekly structure would support renewed upward momentum.
⬤Zooming out, ASTS continues to follow a cycle of strong expansions and deep consolidations that reset the trend before another rally. Even during recent volatility, the long-term chart structure has held. As detailed in AST SpaceMobile Holds Rising Channel With $1B+ in Contracted Revenue, the company's broader technical framework remains intact, with the upward channel holding despite near-term pressure.
 Saad Ullah


