 Saad Ullah

⬤AST SpaceMobile is pushing toward a critical technical threshold on the weekly chart as the stock hovers in the $92-$98 zone. Traders are monitoring whether ASTS can wrap up the week above $98 and reclaim its weekly Hull Moving Average ribbon. The chart reveals the stock moving within a rising wedge structure, where price has bounced repeatedly off the lower trendline while hitting resistance near the top boundary.
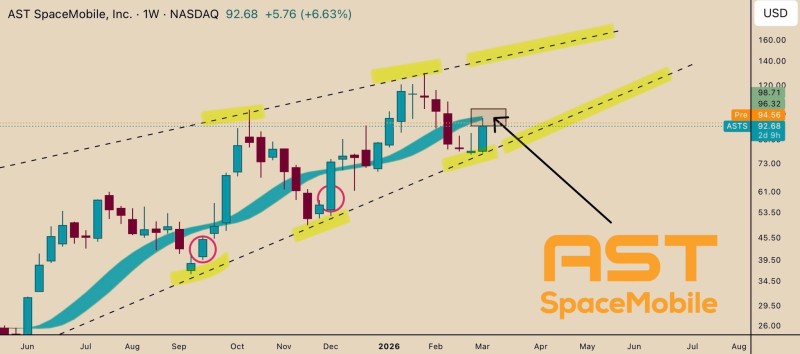
⬤On the weekly timeframe, the pattern shows a clean sequence of higher lows forming along the ascending support line. Multiple earlier pullbacks have honored this lower edge, reinforcing the broader uptrend channel visible in the data. Recent candles show ASTS trying to break back above the moving average ribbon following a brief consolidation. Technical commentary on AST SpaceMobile's weekly trend structure points out that the stock has maintained organized consolidation phases even when volatility spiked, keeping the larger trend alive.
⬤The focal point right now is the $98 mark. A weekly close above this barrier would place ASTS back above the 1W HMA ribbon and boost the odds of a run toward the wedge's upper trendline. Still, rising wedges are generally viewed as bearish structures if they eventually crack downward. Until that breakdown happens, the chart suggests momentum remains solid. Recent analysis of ASTS stock consolidation also notes that the stock has often traded inside defined channels before making larger directional shifts.
⬤The current setup puts AST SpaceMobile at a pivotal crossroads where the reaction around $98 could shape the next leg of price movement. If the stock holds above the weekly ribbon, the wedge's top edge may become the next technical destination. On the flip side, failing to maintain that momentum could leave the pattern exposed to a breakdown, even as the stock has repeatedly navigated consolidation structures while preserving an upward channel on higher timeframes.
 Saad Ullah


