 Usman Salis

⬤ ASTS is still riding a solid uptrend on the two-week chart, even though it's been cooling off lately instead of pushing higher. The stock surged from 2024 lows all the way up to around $120 before pulling back. Right now, it's consolidating rather than breaking down, and the overall structure still looks bullish—traders are watching to see if it'll retrace further or break out again.
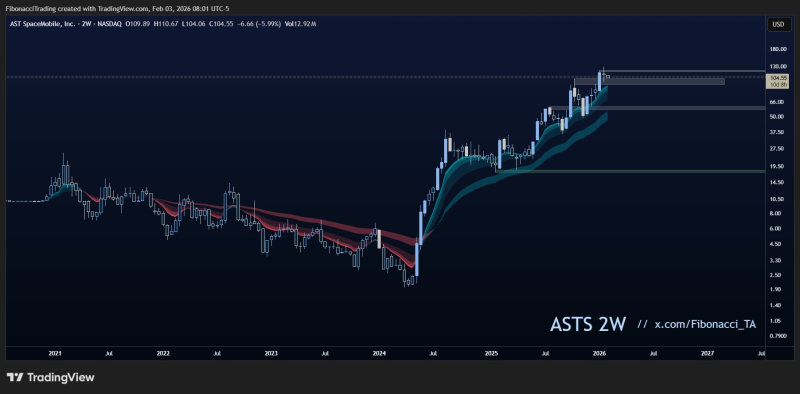
⬤ The two-week chart tells the story: AST SpaceMobile shook off a long correction and started climbing hard in 2024. It stacked up higher highs and higher lows, confirming the trend shift. After hitting the $120 zone, ASTS eased back toward $100 and started consolidating there instead of collapsing. The trend bands are still pointing up, which means the dominant direction hasn't changed.
⬤ The technical zones are pretty clear here. The $90–$105 range is highlighted as a potential pullback area within the uptrend—it lines up with previous consolidation and dynamic support. Above that, $120 is the resistance level to watch. A clean break above it would signal the trend is back on. So far, ASTS hasn't made any lower lows during this pullback, which suggests sellers aren't in control yet.
⬤ This setup matters because higher-timeframe trends usually drive what happens during consolidation. AST SpaceMobile is trading well above its earlier base, so this pullback looks more like a breather than a reversal. With ASTS sitting between support and resistance, how it moves from here will likely decide whether it resumes the rally or keeps consolidating. What happens next could shape momentum and stability for the months ahead.
 Usman Salis


