 Usman Salis

⬤ AMD is quietly compressing on the 2-week timeframe after a strong push higher, with price hovering around the $200 area. The whole setup hinges on whether $185 keeps acting as the floor. The chart shows AMD pulling back from the mid-$200s while staying above a clearly defined horizontal support band between $185 and $190.
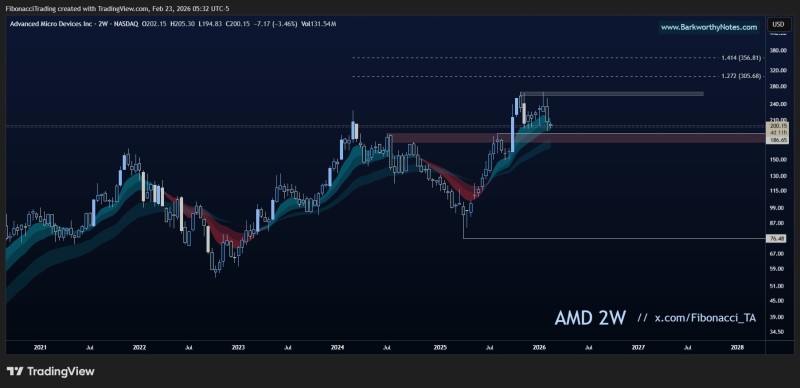
⬤ The key idea here is a resistance-to-support flip at $185. That zone used to cap price before the breakout and is now being retested from above. If AMD holds $185 as support, it signals the market is accepting the breakout rather than rejecting it. A similar technical pause played out during consolidation near the $207 resistance zone, where price tightened before picking a direction.
⬤ The chart also shows Fibonacci extension targets well above current levels, with projections near $305 and $356 sitting on the horizon, though AMD has a lot of ground to cover before those come into play. Right now, the focus is simple: does price stay above the mid-$180s floor as the range keeps squeezing? Prior analysis pointed to the $221 level in focus after a pullback from $250, which shows just how much defined price checkpoints matter in shaping AMD's structure.
⬤ The $185 zone is now a clear decision point. A sustained hold above it keeps the bullish thesis alive within the 2-week contracting pattern. But losing that level would shift the conversation quickly, opening the door to deeper support tests. That downside risk ties directly into earlier warnings around the risks of a move below the $200 psychological threshold, where round numbers tend to amplify both sentiment and selling pressure.
 Usman Salis


