 Marina Lyubimova

Advanced Micro Devices just failed to hold above the upper boundary of a Gann arc formation — and now the $200 level is everything. Flagged the rejection as a shift in focus toward key support, and the chart is backing that read up.
AMD Double Top Near Highs Puts $200 Support in the Crosshairs
AMD is currently trading around the $207 zone after getting turned away from the upper resistance area multiple times. The resulting double top pattern is hard to ignore — it's a classic sign that buying pressure is drying up at the highs.
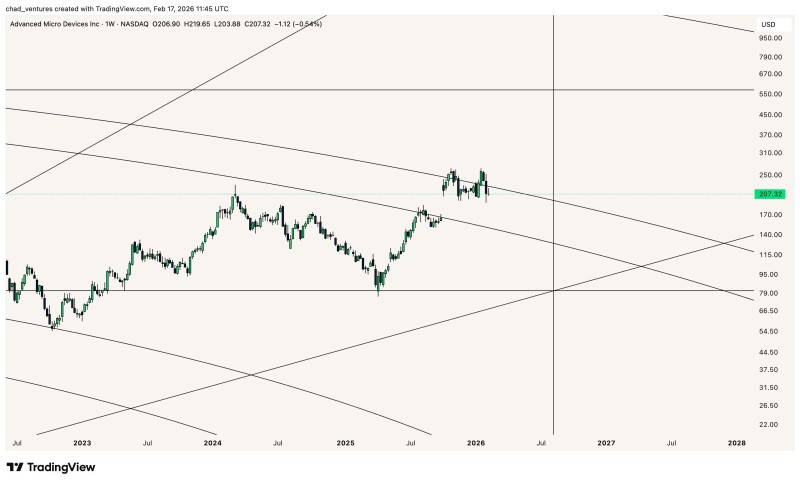
Right now, $200 is the line in the sand. A clean close below it would raise the probability of a downside continuation toward an open gap — a setup traders have been watching in AMD Tests Key Trendline Support Near Gap Fill Zone.
What the Price Structure Is Actually Telling Us
The current consolidation looks more like a pause after rejection than a full reversal — at least for now. But the longer AMD fails to reclaim higher levels, the more sellers stay in control of the tape.
This kind of resistance failure isn't new for AMD. A nearly identical dynamic played out in AMD Stock Analysis: Struggling Below Key Resistance, where repeated rejections from overhead kept any real upside off the table. The current setup rhymes with that — same resistance behavior, same elevated downside risk.
Holding above $200 would keep AMD inside the broader range and give bulls a chance to stabilize. Losing it, though, makes the case for a deeper corrective leg within the wider trend structure a lot harder to argue against.
 Marina Lyubimova


