Peter Smith

Amazon's long-term chart is getting attention again, and for good reason. The stock is once more sitting on a trendline that has held through every major market crisis since the company went public. That kind of structural support, spanning nearly three decades, tends to matter when investors try to figure out where AMZN goes next.
A Trendline That Has Survived Every Market Crash Since 1997
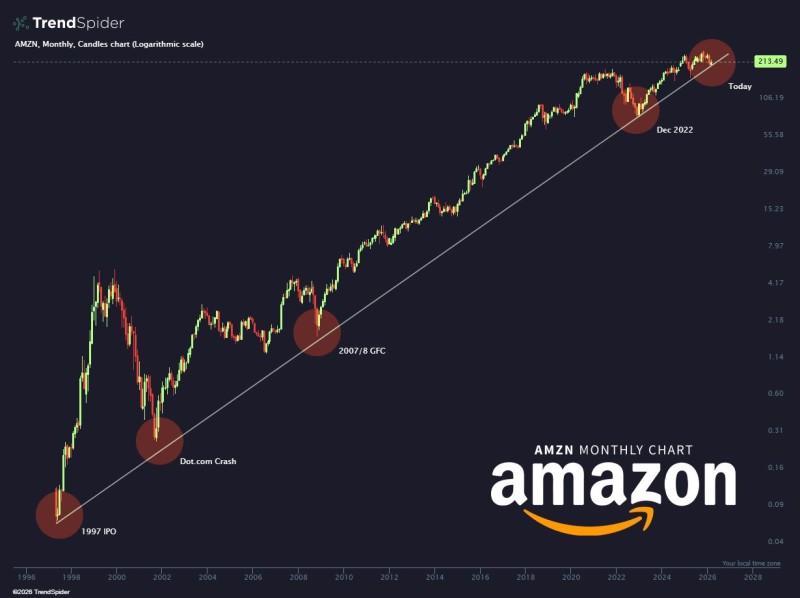
On the monthly logarithmic chart, Amazon's price has repeatedly respected this ascending support line across wildly different market conditions. The dot-com collapse in the early 2000s, the 2008 global financial crisis, and the sharp 2022 correction all brought AMZN back toward this line. Each time, the stock eventually stabilized and pushed higher.
AWS at 25%-38% Growth and 16x Cash Flow: Is AMZN Undervalued?
The technical setup isn't the only thing drawing attention. Amazon Web Services growth is expected to accelerate beyond 25% this year, with some institutional estimates, including projections from UBS, pointing toward roughly 38%. Meanwhile, the stock is trading around 16 times operating cash flow, which many analysts consider relatively moderate by Amazon's own historical standards. As covered in AMZN Stock Valuation Falls to a Decade-Low, Amazon is currently near some of its cheapest valuation readings in years.
The combination of compressed valuation and renewed cloud momentum is what's making this trendline test feel different from previous ones. Investors watching AMZN aren't just looking at a chart pattern. They're weighing whether a stock trading at decade-low multiples, with accelerating cloud revenue, represents a structural entry point or just another pause in a long uptrend. For more on the broader Amazon growth thesis, see AMZN Targets $260-$350 as Amazon's $10B Chip Business Fuels New Growth Story.
 Peter Smith